I’ve always been a bit fascinated by radio and wireless communication, so I decided to get some commodity SDR dongles like the RTL-SDR blog V4 and see what I could hear, if you know what I mean. Several DIY antennas and long distance receptions later, I started to wonder what else (beyond communication with other enthusiasts) easy access to an SDR receiver could unlock. That led me down the path of amateur satellite reception — a relatively niche corner of the already niche amateur radio hobby.
In short, there are satellites orbiting Earth, typically funded and operated by governments, that broadcast scientific data and telemetry down to the surface for anyone to receive. Weather satellites are generally the most interesting, and NOAA’s Geostationary Operational Environmental Satellites (GOES-R) and Polar Operational Environmental Satellites (POES) (often simply called NOAA satellites) fit the bill. Often broadcasts from satellites require very expensive reception equipment, but there are several in orbit with relatively accessible broadcasts for the DIY/amateur crowd, including the High Rate Image Transmission protocol used by GOES-R and the APT protocol used by the NOAA polar satellites.
Advances in Radio Reception
It’s not particularly new in an absolute sense, but the processing power and speed of modern computers and high speed digital electronics completely revolutionized the art of radio by allowing much more precise control/measurement of the voltage levels representing electromagnetic signals at the start and end of wireless broadcast pipelines. This increasing control has spawned a sub-field called software-defined radio (SDR) and now software-programmable hardware exists to allow down-conversion and digitization of very high frequencies, which can then be decoded in software with commodity computing hardware.
Today, an SDR USB dongle paired with control software like SDR++ and decoder software like SatDump can acquire and decode into human viewable results basically any kind of satellite broadcast known to amateur radio enthusiasts. The hard part is managing to get an appropriate antenna setup with a high enough SNR for the decode to be successful, which requires knowing a bit about the physics of the broadcast. Since satellites are far away (and some farther than others), and have proportionally weak signals, throwing a random wire up into the air is not going to work as well as it does for terrestrial broadcasts. Dedicated receivers constructed with the size and topology of the electromagnetic waves taken into account will be required. Sometimes these receivers will have to be highly directional and concentrating (achievable with a so-called satellite dish) to get a signal above background noise levels.
NOAA APT (137 MHz)
NOAA satellites are in polar orbits, meaning their primary motion is perpendicular to the rotation of the Earth, and there’s no chance of them appearing stationary. This tends to give them several North-South or South-North flyovers each day, though not often at very high angles. I found the tool at the bottom of this page quite useful for finding acceptable flyover times.
There are three NOAA satellites transmitting APT (currently in 2025): NOAA-15, NOAA-18, NOAA-19, all with their own broadcast frequency in the polar satellite band at 137 MHz. Because they are moving, reception tends to fade in and out as obstructions traverse the line of sight path unless you have a very clear view from horizon to horizon. Somewhere around 8-10 minutes is the longest a satellite will be visible, and that’s just enough time to get a decent image from a recording.
Here you can see the antennas mounted (over my tomato enclosure) and a nifty waterproof project box housing the low noise amplifiers near the antennas before being routed out of frame towards the house.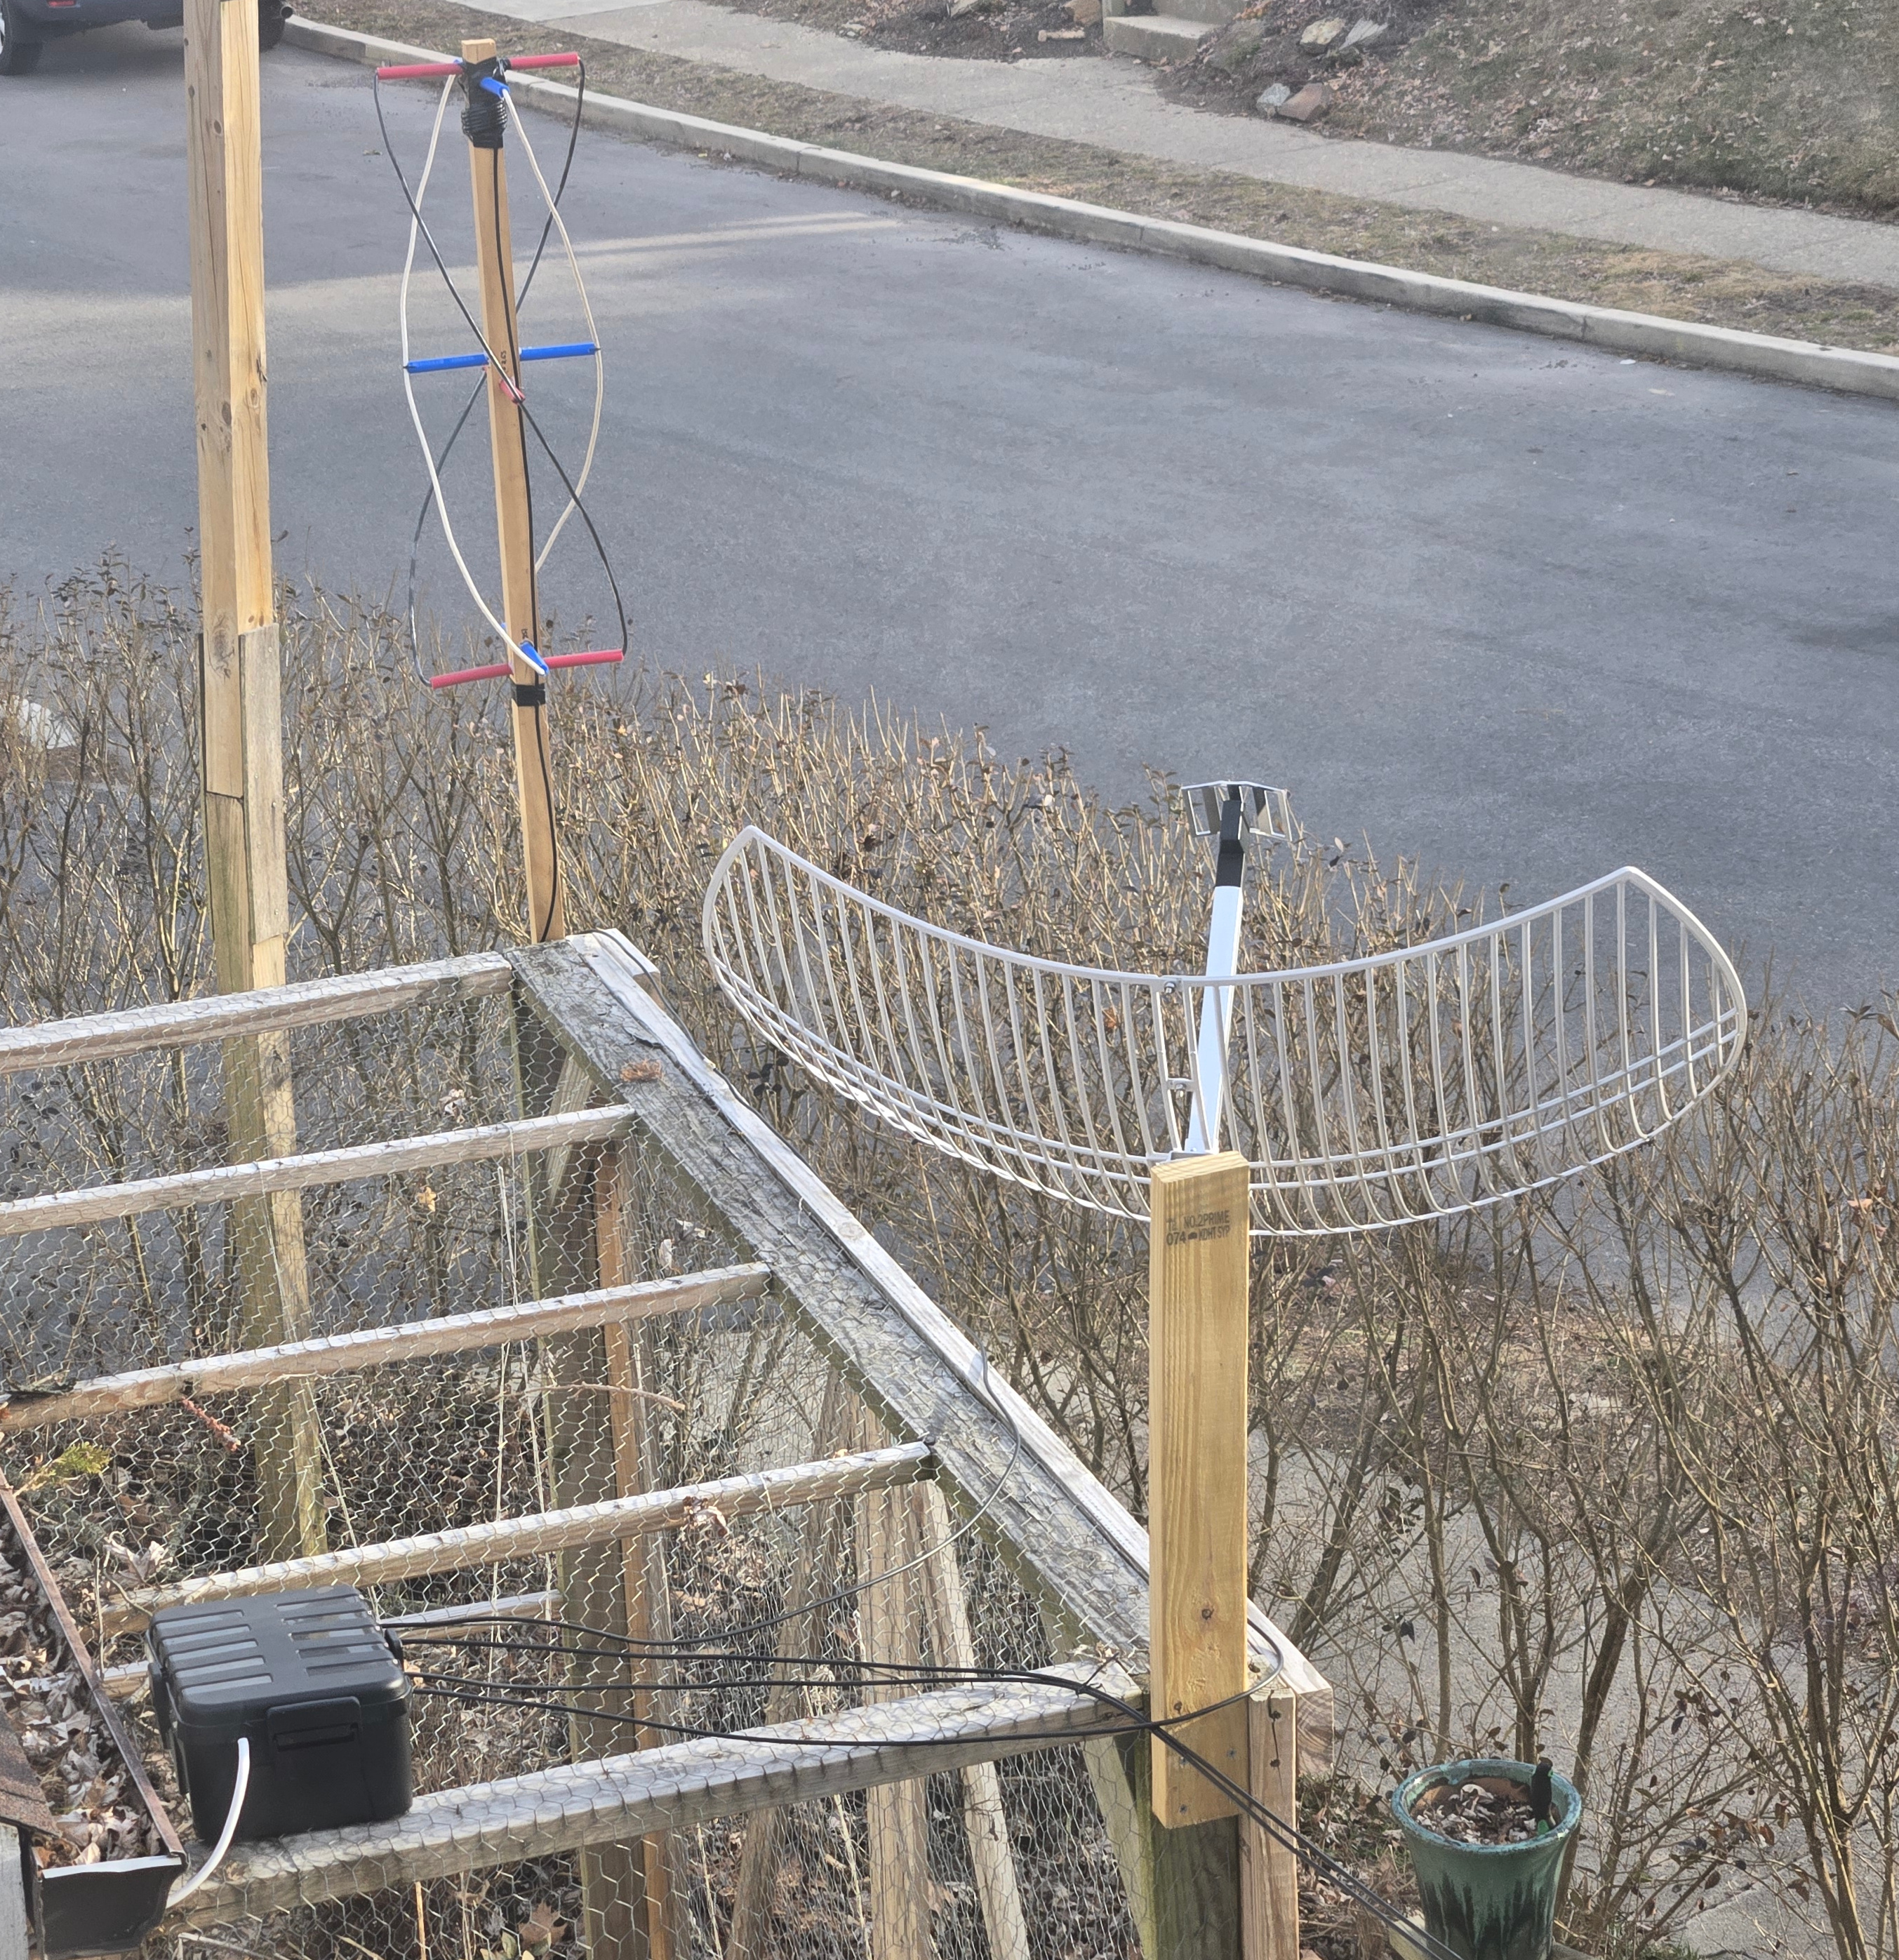
Even with an acceptable antenna, the signal is quite weak due to the distance of the satellite. To mitigate this, I have a notch filter and low noise amplifier for the ~137 MHz band (Nooelec Sawbird+ NOAA but other options exist) installed very near the antenna. This ensures noise and irrelevant signals are rejected while amplifying the frequency range where the signal appears. Ultimately this feeds an off the shelf SDR dongle (Nooelec NESDR Smart v5) with the gain set to maximum via ten meters of RG-58. With an appropriate antenna, and tuned to the correct frequency for the NOAA satellite of interest, I had no real issues receiving and decoding with SDR++ and SatDump the images below. Potential future improvements would be to mount the antenna higher, with better line-of-sight to the horizon.
The Quadrifilar Helical Antenna
The QHF antenna I built with some spare parts and RG-58. Note the turnstile components connected together with for short helical wires.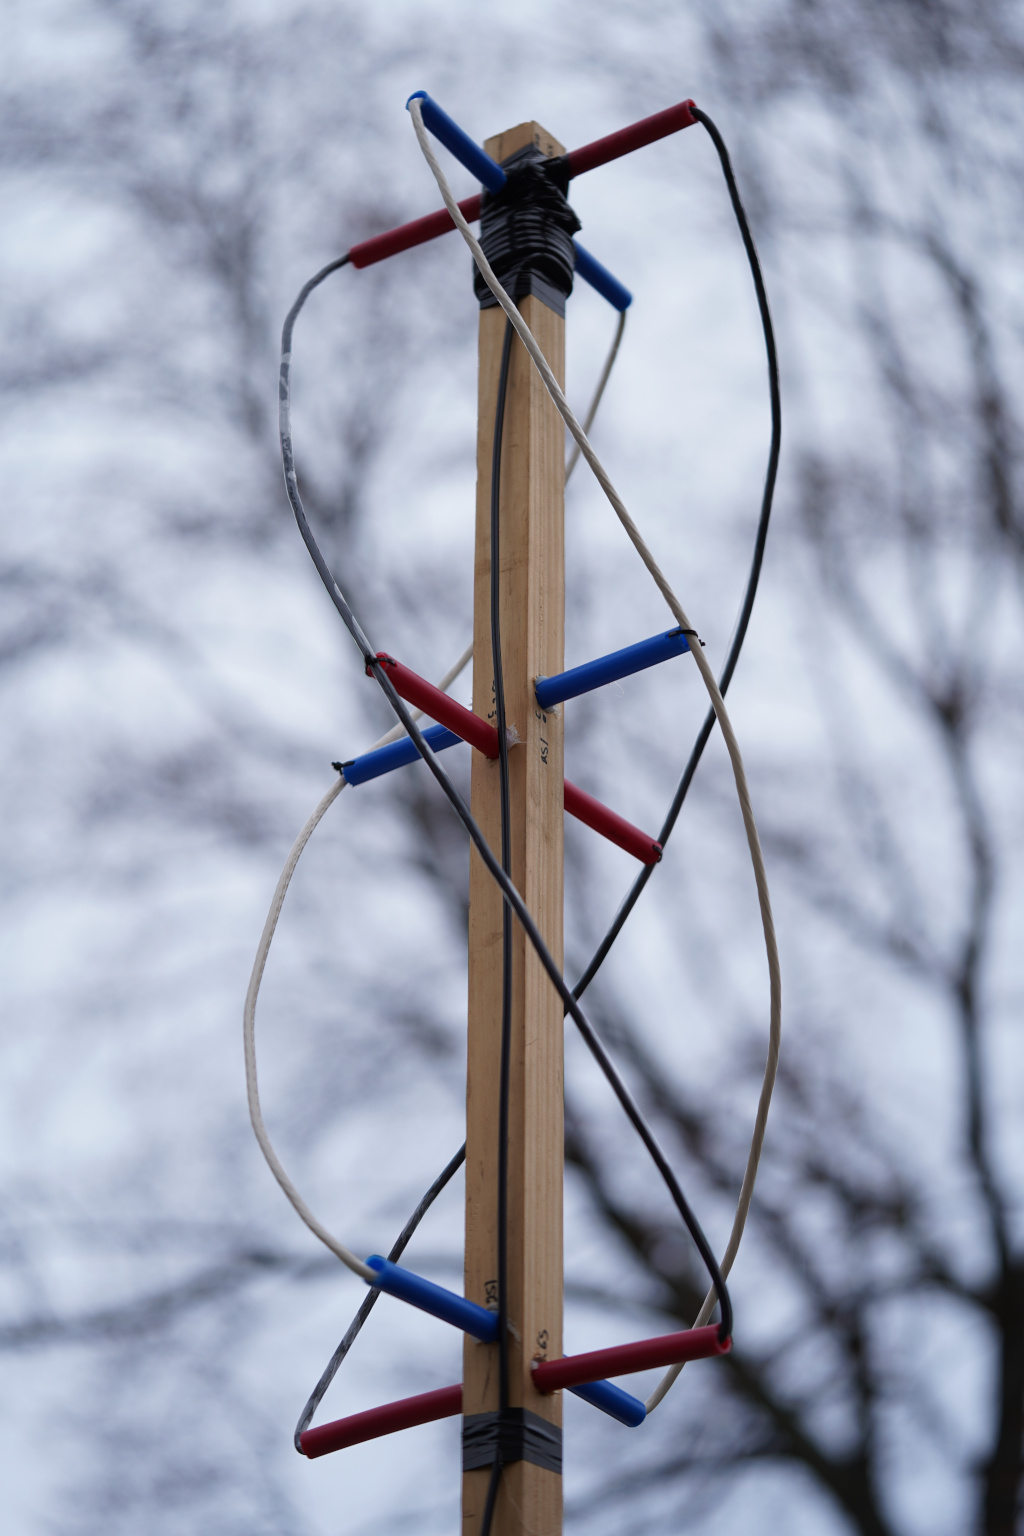
The turnstile component is a well-known way to generate and receive circularly polarized signals off the axis of the turnstile, but it produces horizontally polarized broadcasts perpendicular to the axis. Interestingly, the helical part, in normal mode radiates a vertically polarized signal horizontally at the right phase to make the combined horizontal component also circularly polarized. The axial mode component of the helix is in phase with and enhances the turnstile’s axial circularly polarized emission. In total, that gives a fairly uniform ability to send or receive circularly polarized signals from horizon to zenith in one compact form, which is great for avoiding mechanically tracking a satellite across the sky with a more directional instrument.
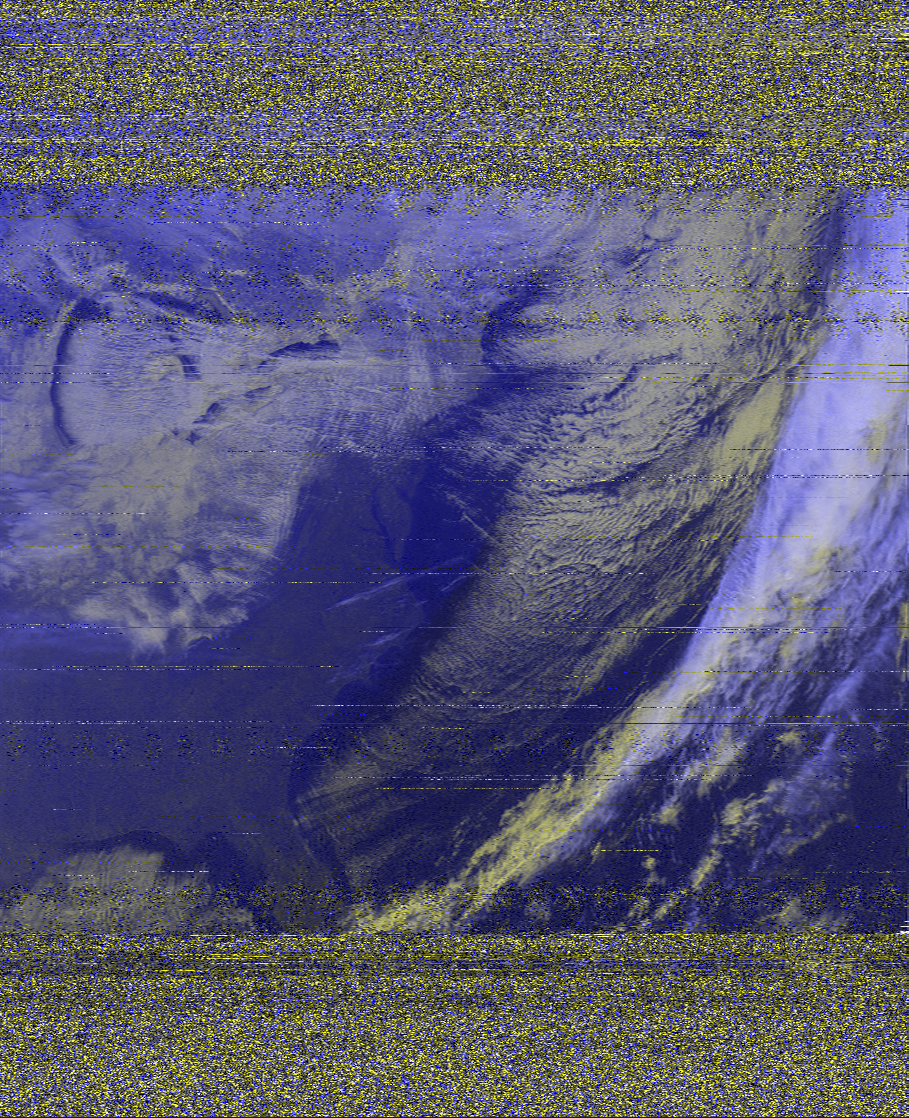
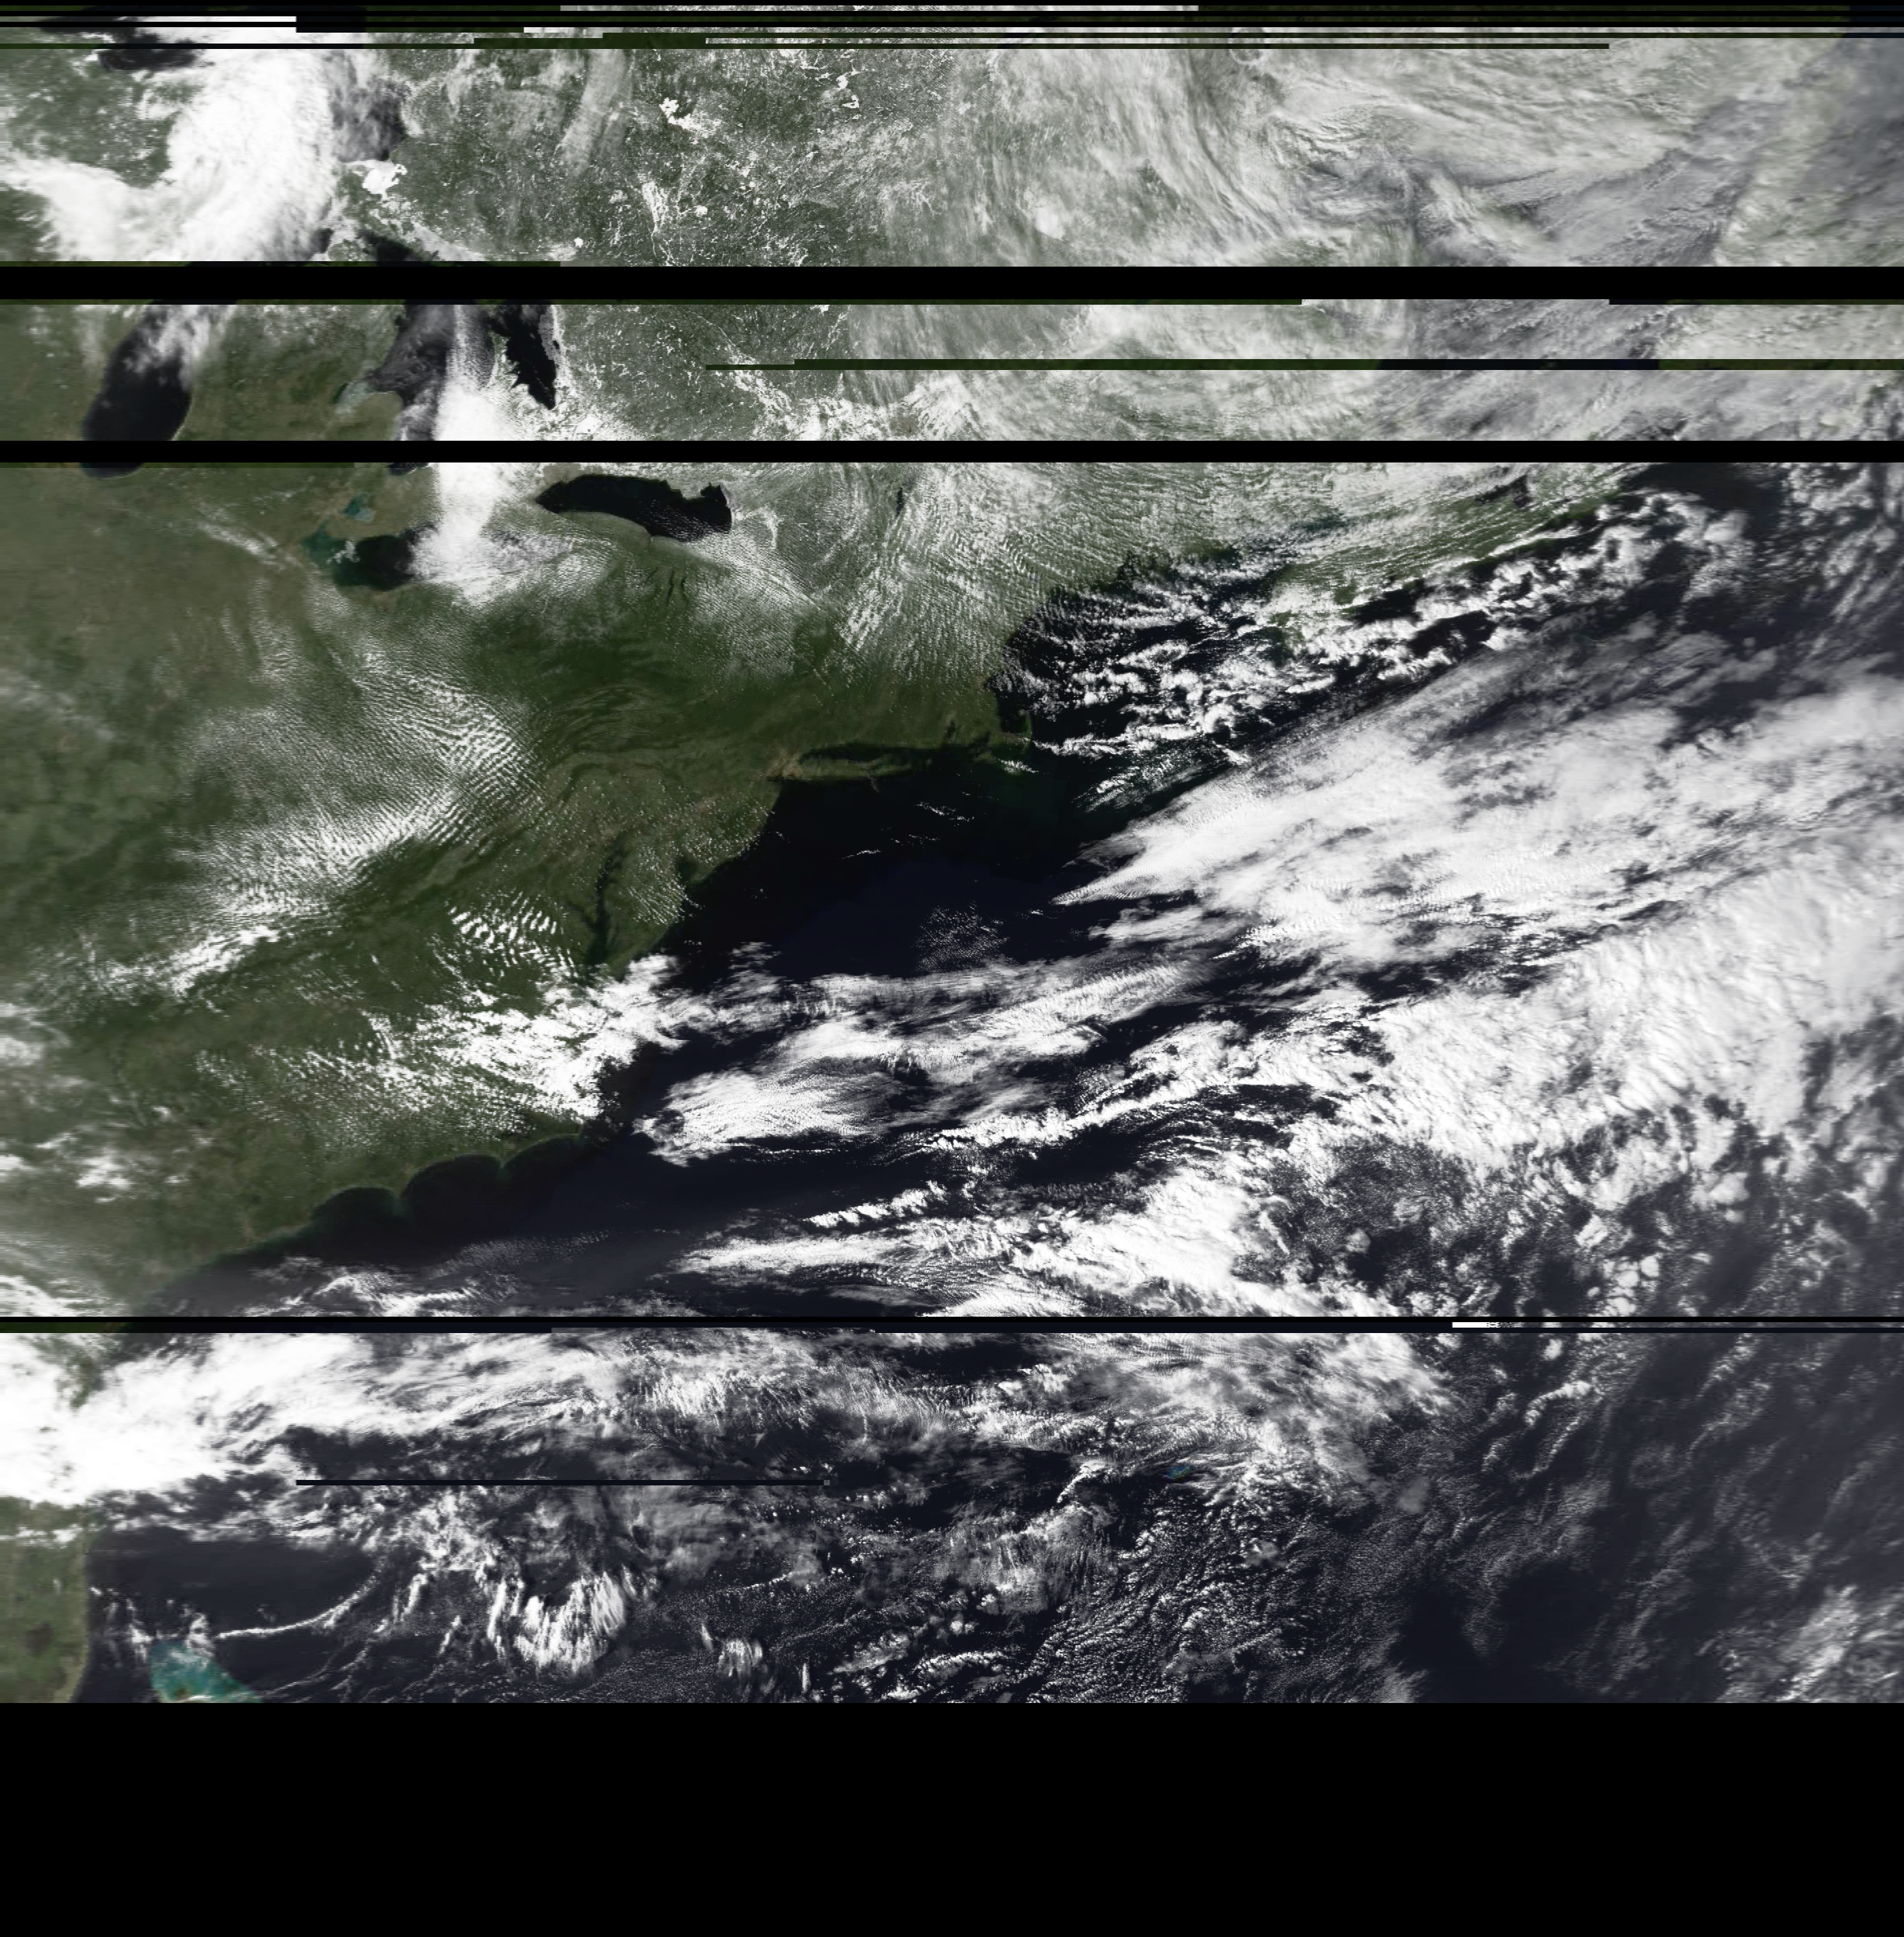
East Coast Flyover 2025-02-17
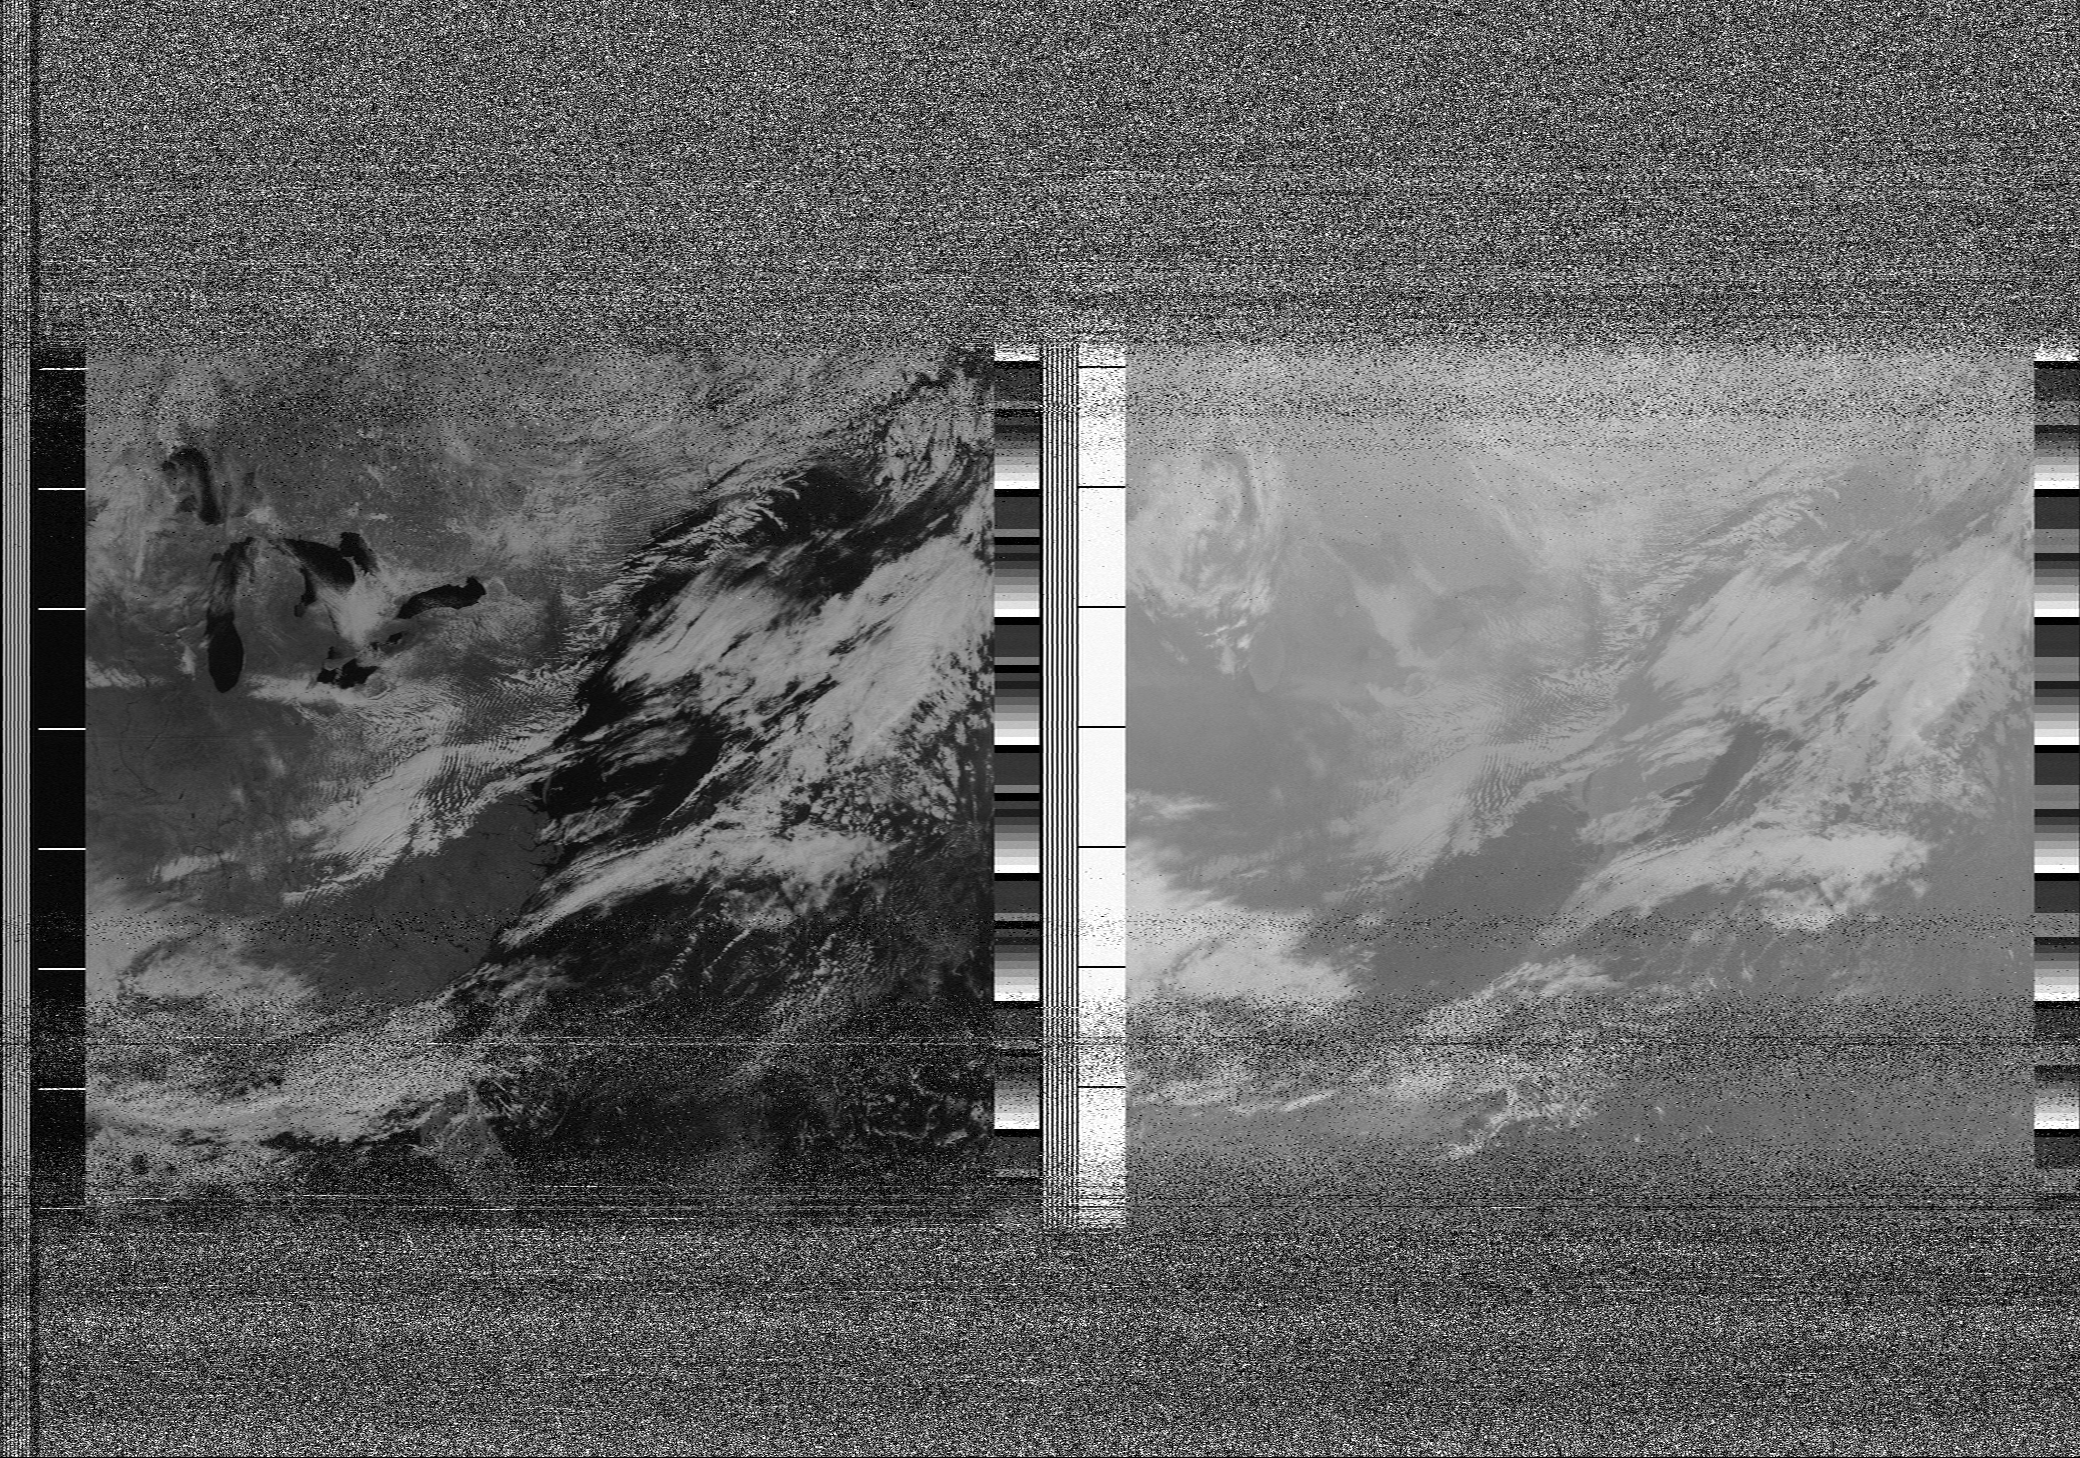
In the span of about 8 minutes, the satellite appears on the horizon and then disappears over the other, assuming a direct pass. Practically, most of the time it’s a glancing blow, and the further the satellite is from zenith the worse the reception is, due primarily to distance as long as there is line of sight. The goal, then, is to capture as much of the broadcast as you can, with the intro and exit being mostly noise. Here, I got a pretty good nearly-vertical flyover of a clearish Eastern seaboard, with a storm front off the coast.
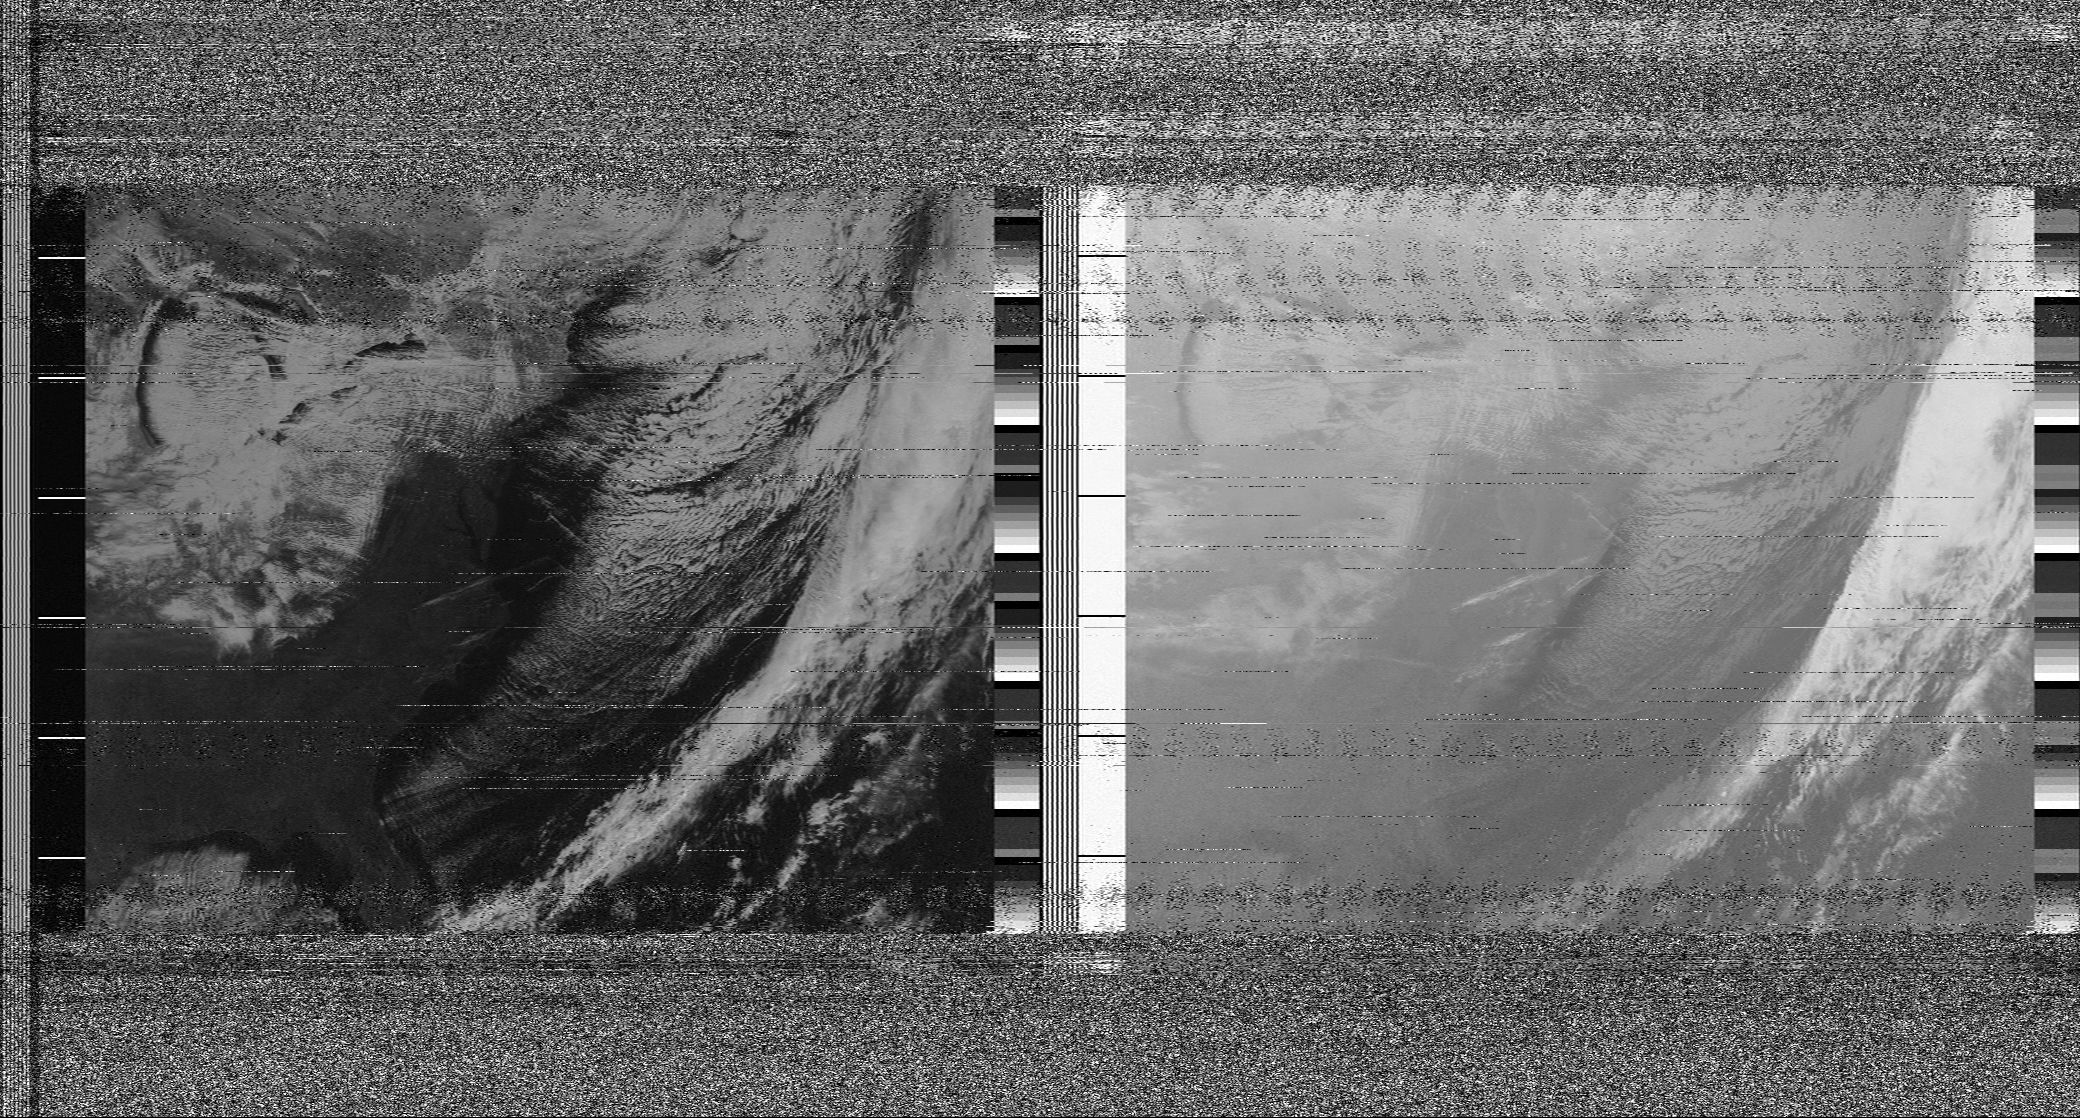
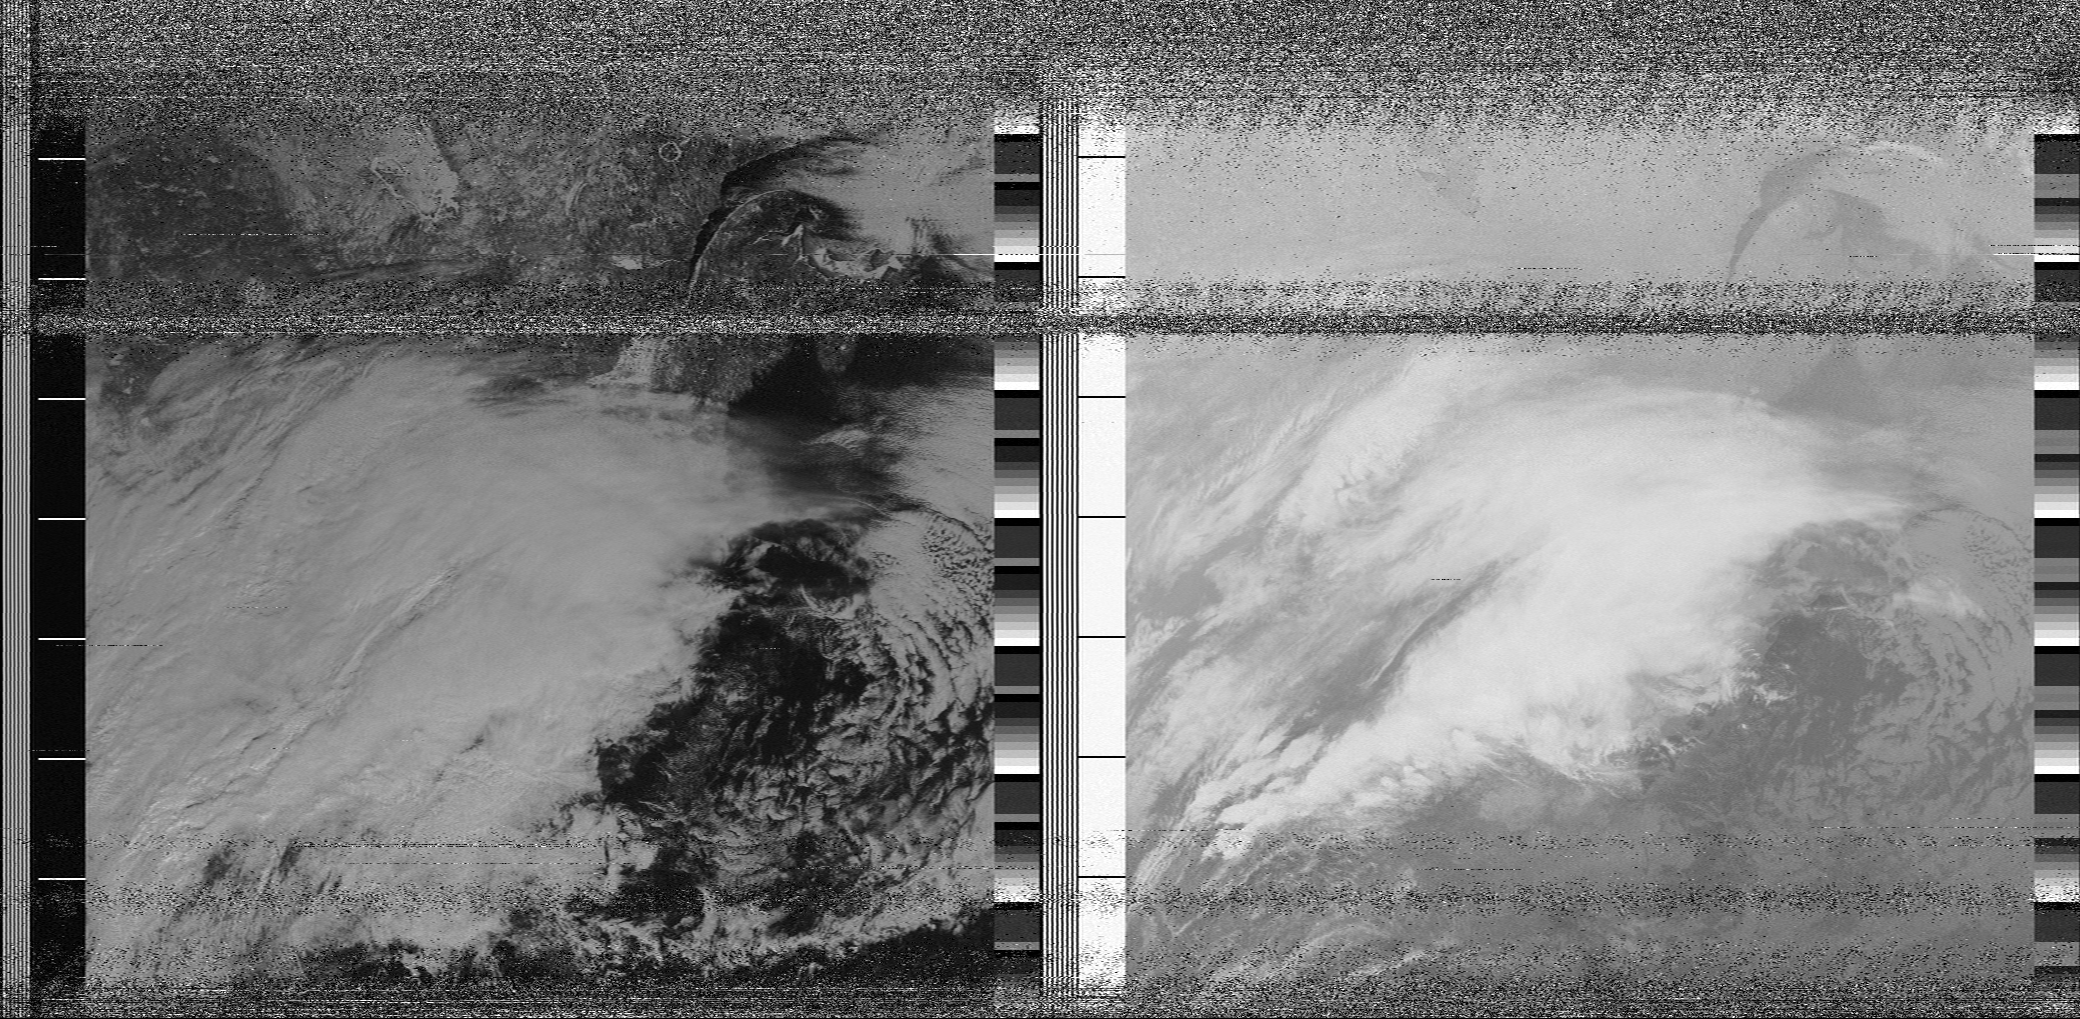
The above image is a representation of the raw data as it is received, with amplitude of the signal at certain times being converted into pixel intensities in an analog fashion. The image is built from the signal in left to right, top to bottom, order and the shaded bands serve as boundary and progress markers for acquiring the start of each horizontal row and image in the transmission. The left and right images are monochrome results of different sensors, so two images are broadcast down at once.
This is a thermal IR view built from the raw data. The blue is a very cold cloud top, with yellows to reds being surface temperatures. This shows cloud cover with whiteness, and convection with a blue hue.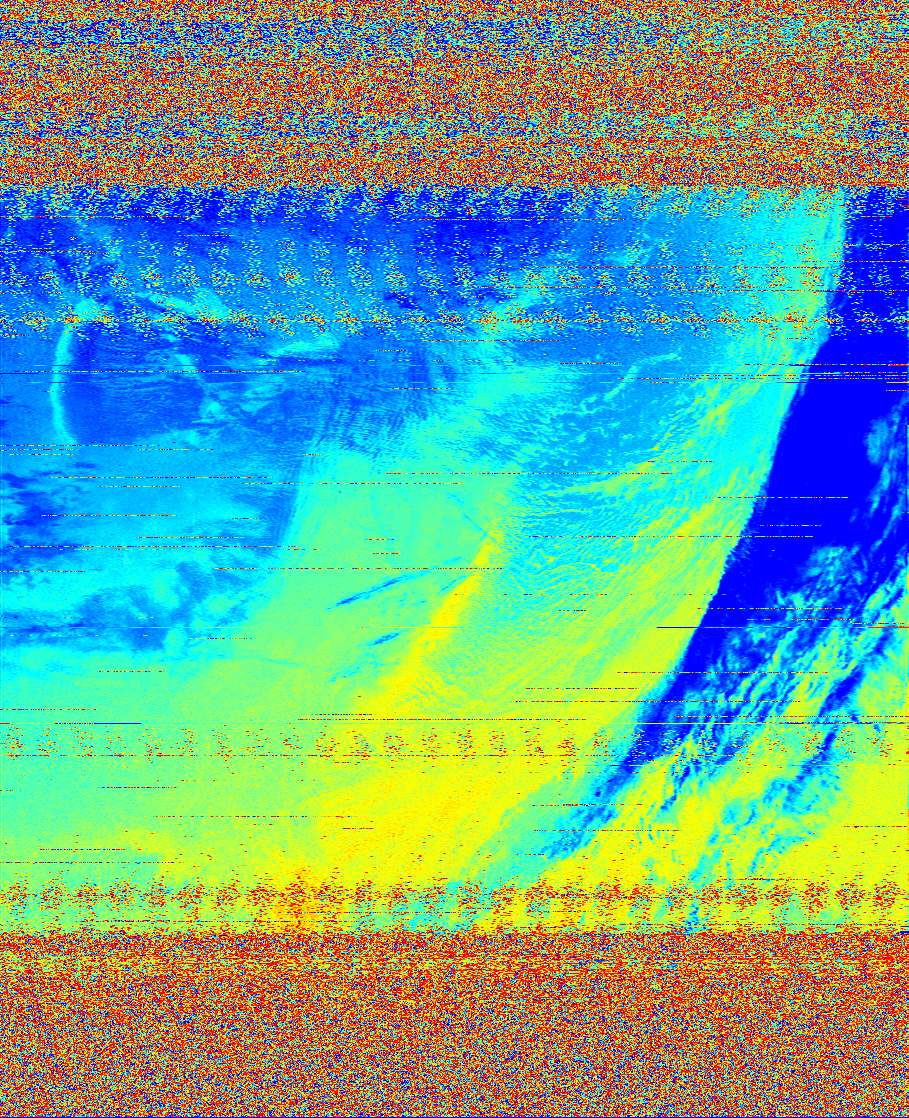
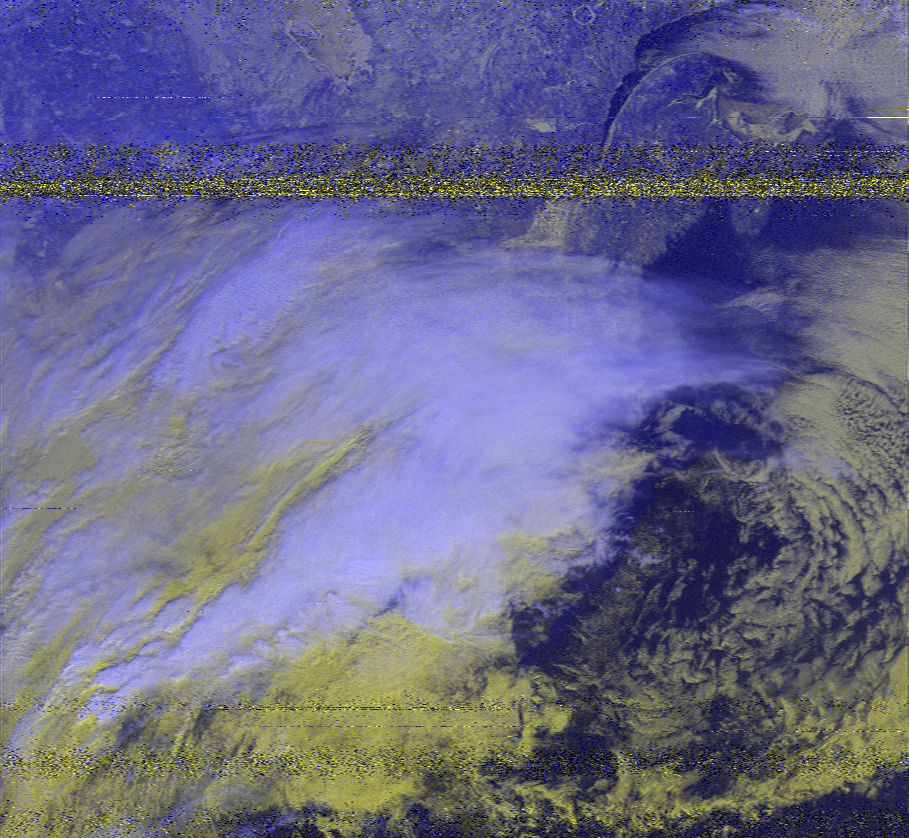
There’s no substantial redundancy or error correction here, so having software reject noise is impossible, and it will show up in the processed results as well. Since noise has a random distribution, the intensity of the pixels in the monochrome image derived from the signal amplitude shows up with random levels of brightness. In some sense this analog scheme means weak signals still contain some data, for a “noisy view”, but in another it means the fidelity of all the data is a bit suspect because it may contain uncorrectable noise. Nonetheless, SatDump will produce some fun-to-look-at PNG outputs with real time weather information.
Southeastern Canada Flyover 2025-02-15
This is a thermal IR view built from the raw data. The blue is a very cold cloud top, with yellows to reds being surface temperatures. This shows cloud cover with whiteness, and convection with a blue hue.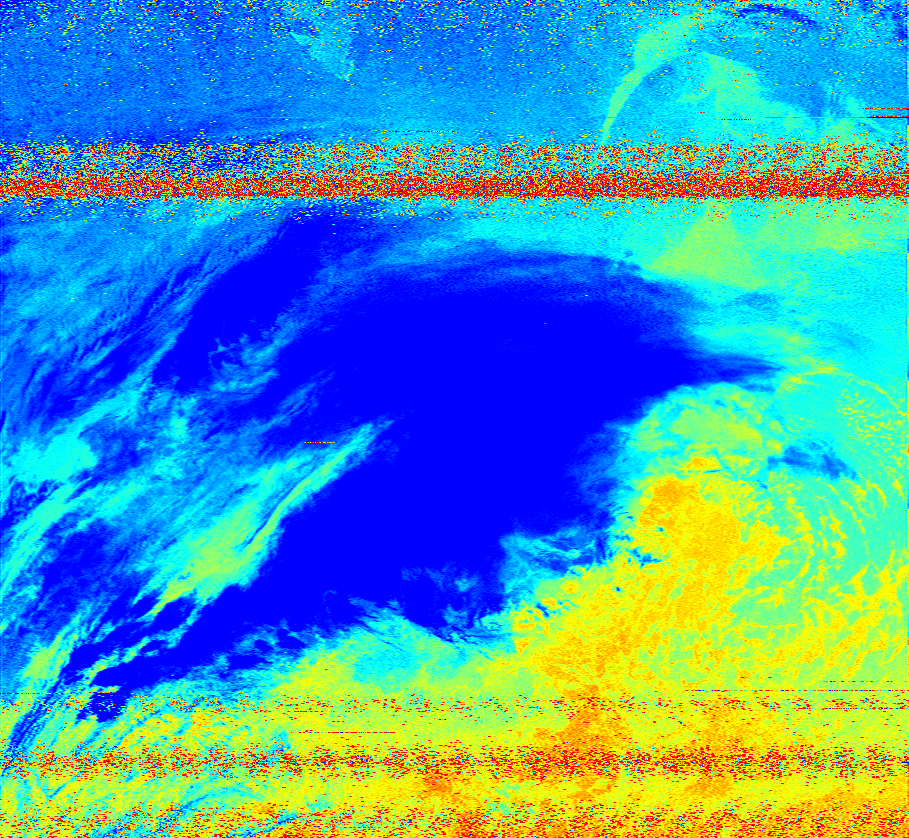
In this one, most of the US is entirely covered by thick clouds, but some ice and snow covered features in southeastern Canada are visible. There is a distinct impact feature that presents as an ice covered circular lake with a large island in the middle near the entryway to the St Lawrence River. Most of the lower right is the Atlantic Ocean. Same basic set of images get produced here, but honestly I think the raw data conveys enough for anyone other than weather scientists.
Eastern & Central US 2025-03-08
On another day with a nearly vertical flyover, I got a very clear shot of the Great Lakes, East Coast, Centralia, and Florida without too much cloud cover. You can see here that even when the noise is very high, there is still some of the synchronization signal visible down the left side if the image.
Meteor-M LRPT (137 MHz)
Before I move on to HRIT, there are also some Russian satellites that broadcast a manageable right hand circularly polarized signal around 137 MHz. Currently operational is the Meteor-M 2-4 weather satellite LRPT broadcast. The production and decoding of this broadcast is very different from the analog APT signal from NOAA vehicles. Rather than encoding image data as analog levels in the baseband signal, the Low Rate Picture Transmission broadcast is a fully digital 144 kbps, with forward error correction, using quadrature phase shift keying (QPSK) to represent the digital data in baseband. Ultimately that means more data in less bandwidth more reliably.
M2-4 2025-03-08
I got one good nearly-vertical flyover of M2-4, which SatDump was able to extract the LRPT signal from, and it does indeed produce higher resolution images than the APT signal. Also, they’re in color! Unlike the analog APT signal, which just produces noise when there’s bad reception, the digital LRPT signal drops out entirely when the reception is too poor for error correction to handle, leaving black voids. This provides crystal clear data, or missing data, no in-between.
The East Coast, Bahamas (!), Florida, and the Great Lakes are all clearly visible in this RGB M2-4 decode, along with some clouds of course. Particularly cool to see the shallow sea in the Bahamas vicinity, and even details like the Finger Lakes.
GOES-R HRIT (1.7 GHz)
The GOES satellites are geostationary, which means they are in orbit at the same angular speed as the rotation of the earth. To achieve this, one has to be very far away from the surface, a bit over 22 thousand miles, making any received broadcast quite weak. Fortunately commodity receivers exist around this frequency, and a compatible dish is not too hard to find. There is nothing particularly unique about the linearly polarized 1694 MHz broadcast besides its relatively high frequency.
A 1.7 GHz dish and receiver from Nooelec you can buy on Amazon.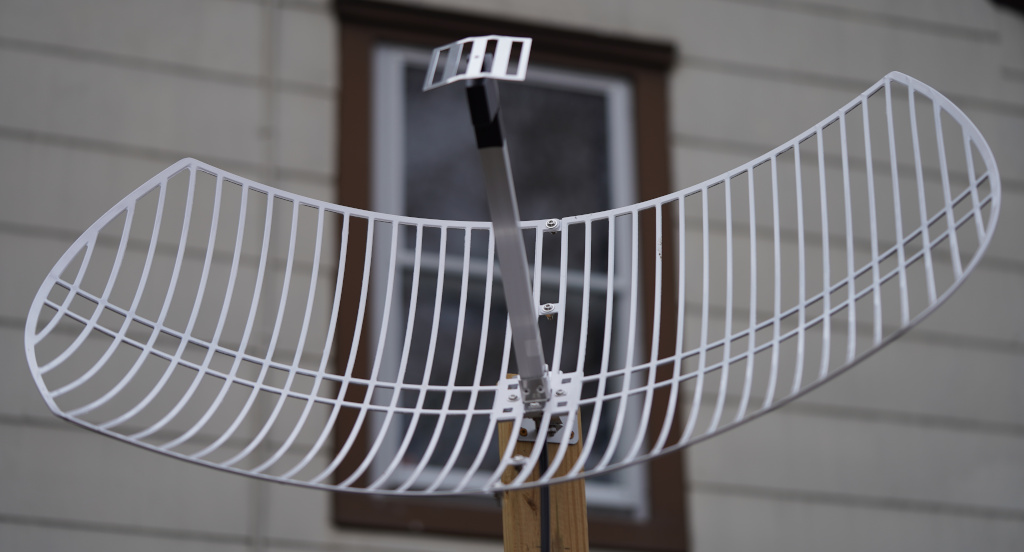
High-Resolution Full-disk Imagery
Being able to point a high gain dish at a fixed target really opens up the available bandwidth and transmission time, and HRIT exploits that with a full 1.2 MHz of bandwidth. This ultimately allows an error correctable signal to carry a data rate of 927 kbps down from space to anyone willing to listen.
For reference, the APT signal above fits comfortably in a 70 kHz bandwidth and had to be delivered in 8 minutes with an effective 1.7 kbps data rate – the quality of the above images is partially due to that constraint. Event he LRPT signal from the METEOR satellites has only a 150 kHz bandwidth, within which it stuffs a 80 kbps data rate. In comparison, GOES-16 provides the following huge, high resolution, full color images along with a ton of other weather information, day and night, constantly.
A full-disk RGB image from GOES-16 on March 27, 2025 via HRIT on 1694.1 MHz. This is scaled down! Click for the full-size version. A GIF of full-disk RGB images from GOES-16 starting around March 3, 2025 via HRIT on 1694.1 MHz. Since the satellite orbits the Earth at the same speed the Earth rotates, the Sun appears to orbit the Earth from the satellite’s perspective! This is scaled down! Click for the full-size version.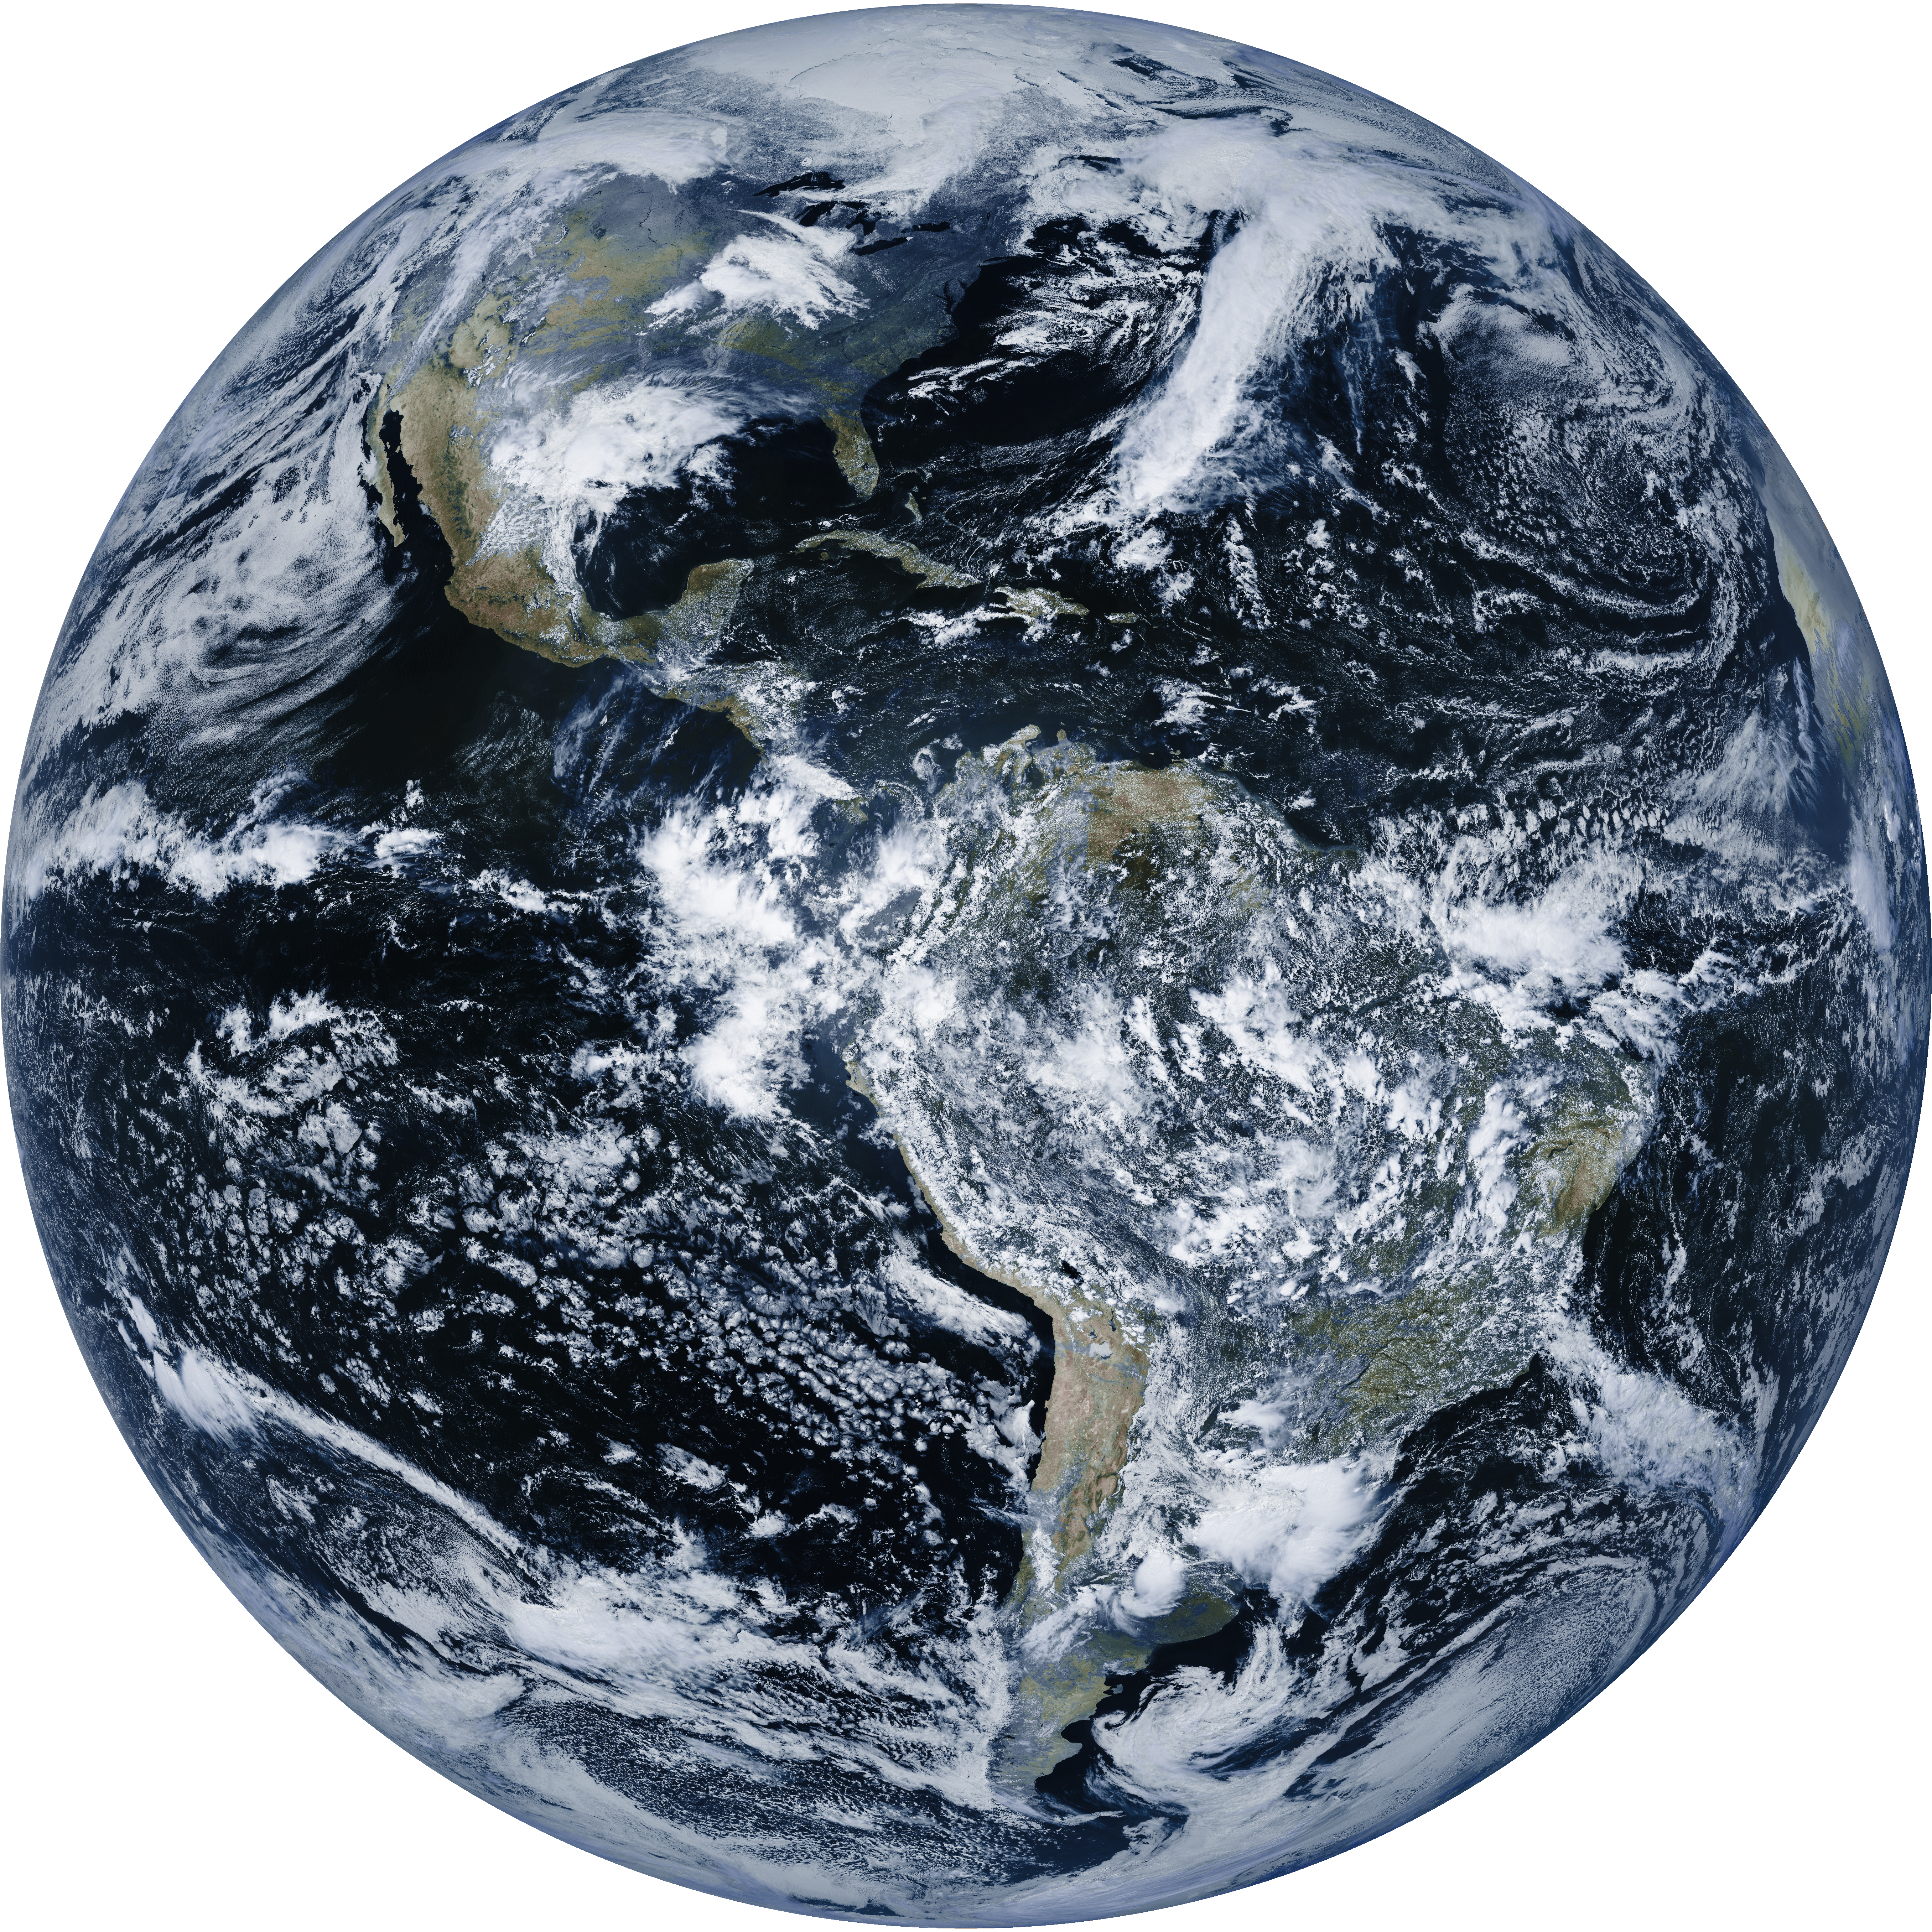
The astute observer would also notice the POES satellites broadcast a HRPT signal around 1.7 GHz, which contains more GOES-like images. Unfortunately, receiving that signal requires tracking the motion of the satellite with a dish, as I understand, so not an easy task at all.
As a Timelapse
And, of course, since GOES is broadcasting real time all the time, I could make a GIF out of the data. A full-disk RGB image comes down every half hour, producing a 39.3 MB PNG image each time. Ultimately this required SatDump to remain connected and receiving data continuously from GOES-16 for several days, and then a Python script to process the huge resulting images into a sequence of frames for a GIF. This happened to be around the time GOES-16 was decommissioned, so were some of its last transmissions!
A Real-time View of Earth
I’ve slapped together a daemonized SatDump and a few bash scripts to provide an up-to-the-fifteen-minutely view of the Earth courtesy of GOES-19 and my radios on ben.land/earth, if you ever want to see the happenings on this hemisphere! The infrastructure supporting this can be found on my GitHub. I’ve considered setting up some kind of tracking and scheduling for the APT and LRPT satellites, but that’s a project for another day.
>> Home