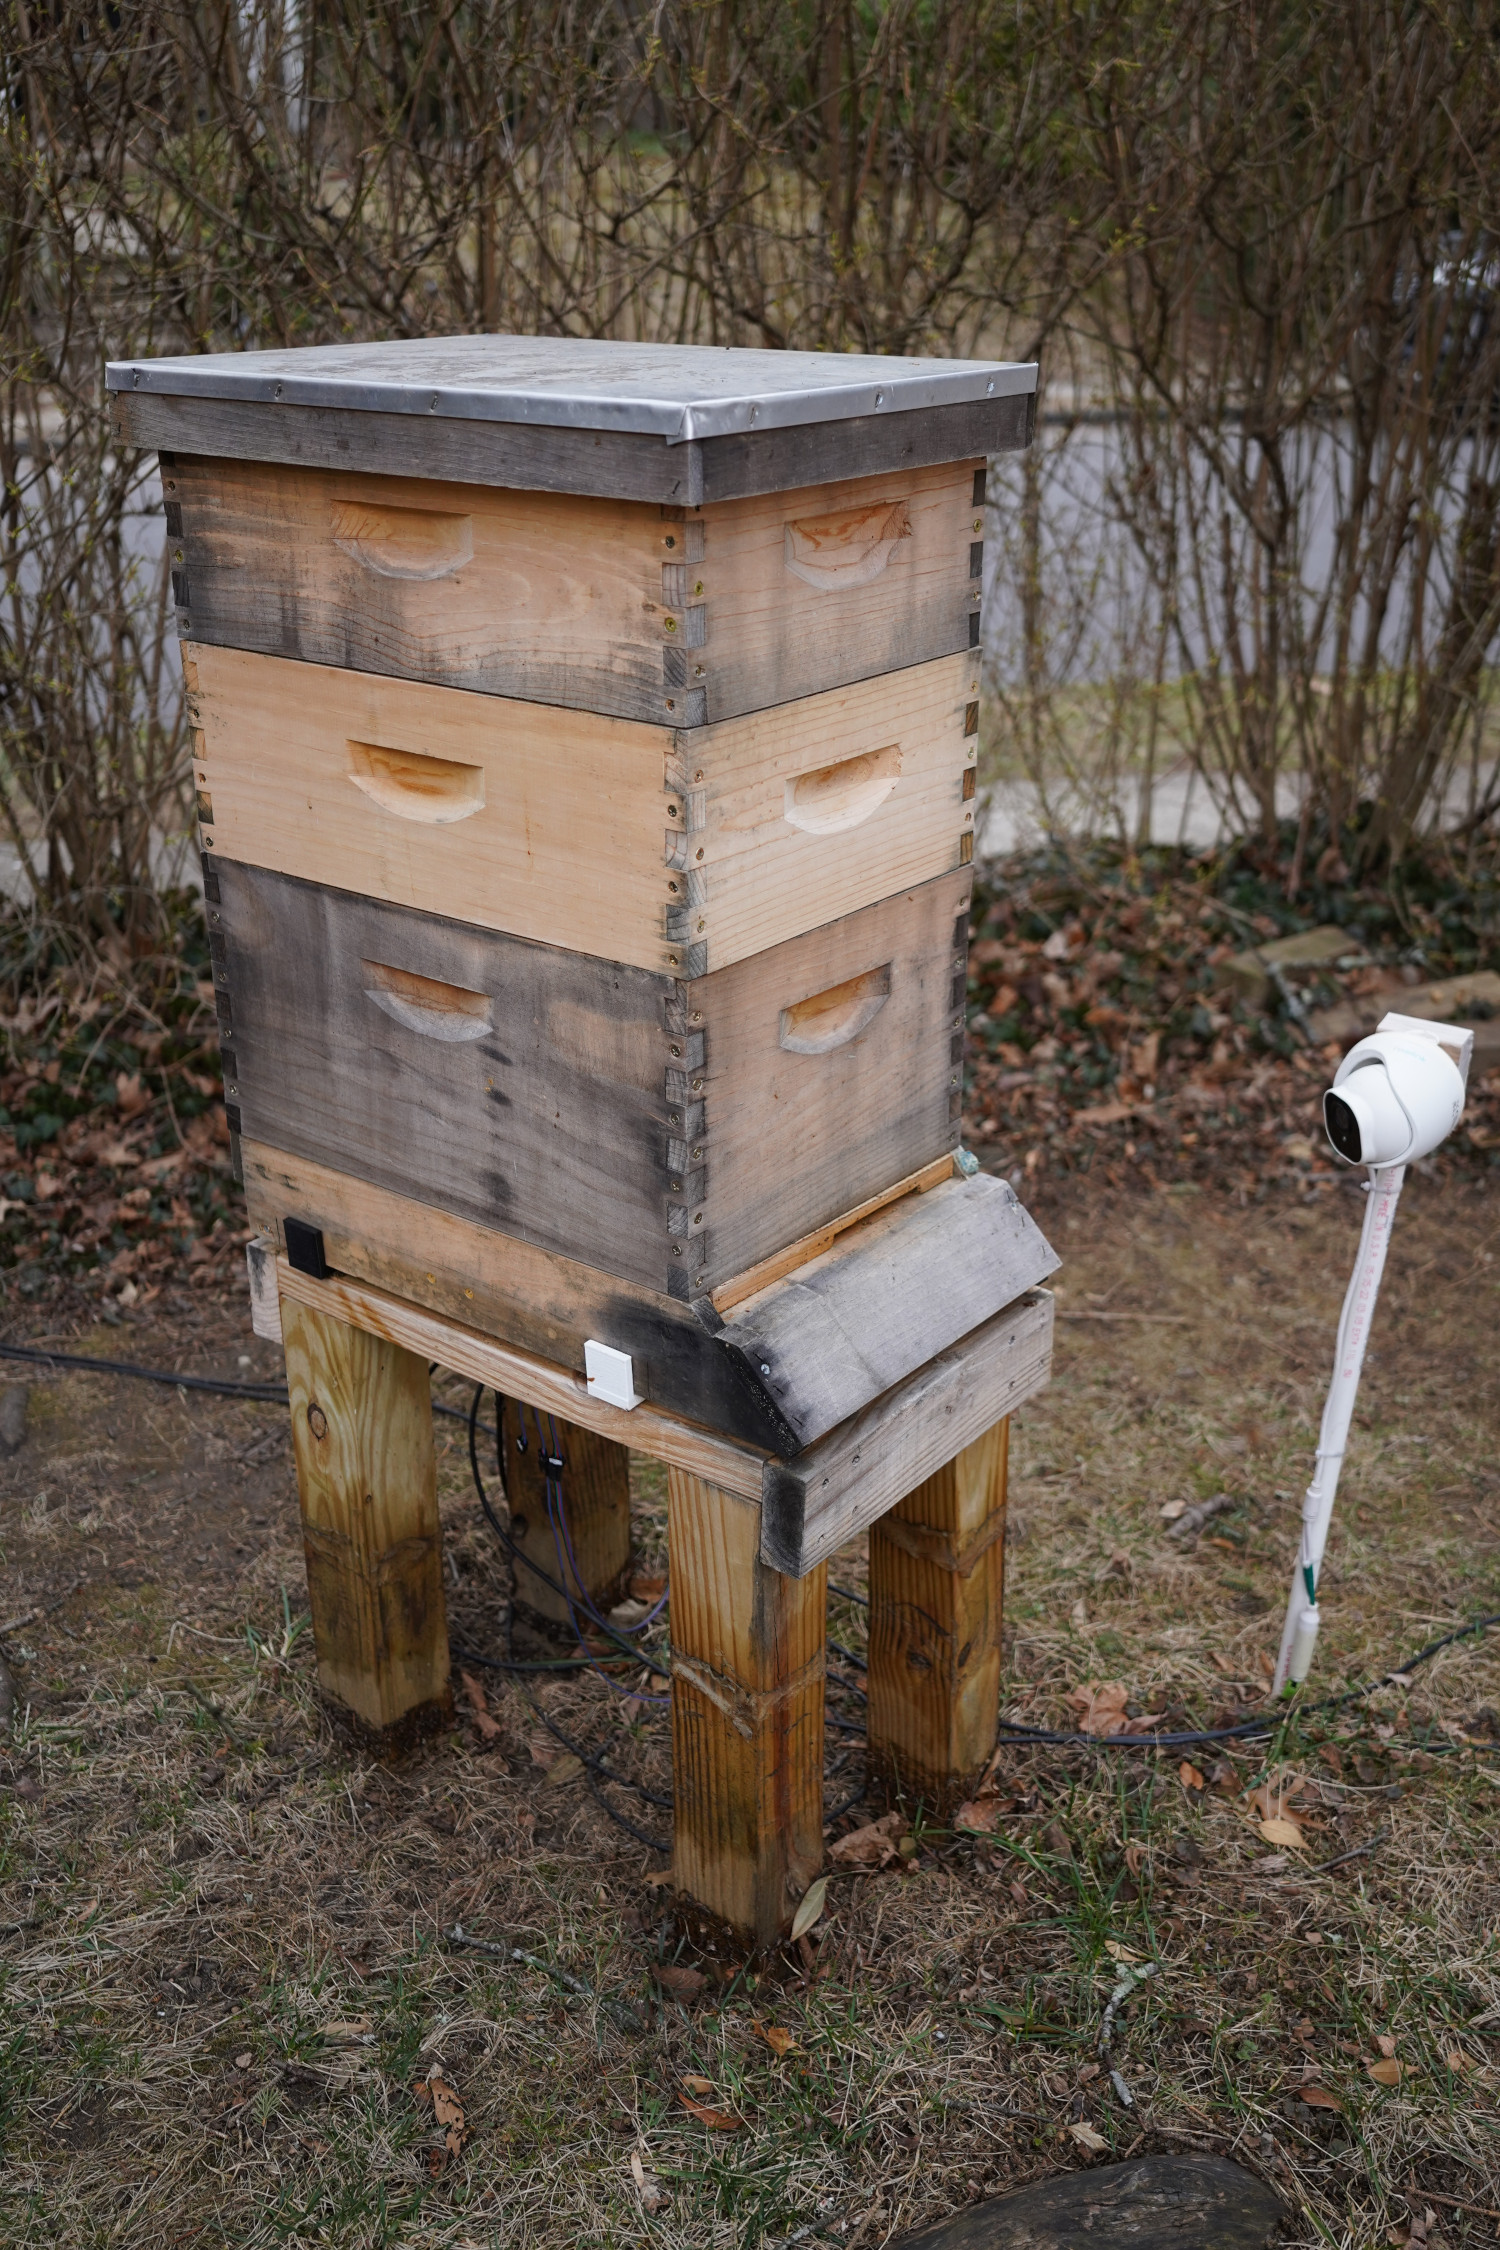
Hive One sitting on the first BeeLogger platform after surviving the 2024-2025 Winter.
With the success of my beehive livefeed and bee-counting neural network in monitoring bee activity, I decided last year it was time to augment my data collection capabilities. Beyond the general activity of the bees that I can already assess, there are several aspects of bee health that can be addressed with off the shelf sensor technology:
- Temperature and humidity of the bee brood during spring
- Conditions throughout the hive at other locations
- Weight of honey / bees / etc in the hive
- Weather conditions outside the hive
The weight of the hive, in particular, lets the beekeeper know if/when a hive may need to be fed, or whether it is prepared for winter. Weight, unfortunately, is something that beekeepers often have to assess with manual lifting of the hives, which can be very inaccurate. By tracking things like this in near real time, with relatively fast sample rates, one may also learn about the daily activity and foraging habits of the bees themselves.
The Hardware
With the goal of enhanced data collection capabilities in mind, my plan was to augment a standard screened bottom board (from Mann Lake) with enough electronics to power and readout some sensors capable of capturing some subset of the above. The sensors themselves typically can be bought as integrated units with I2C communication busses, or something nominally the same.
Commodity / general purpose sensor components
- AHT10 temperature and humidity sensors use I2C, but don’t have programmable addresses.
- Some I2C multiplexer like the TCA9548A will allow stacking many AHT10 on a single I2C line.
- BMP180 I2C barometric pressure sensors will round out the environment measurements.
- Some 50kg load cells and an HX711 clone will get 200kg total capacity for weighing the hive. These have some SPI-like interface, which is fine, as the only non-I2C component.
- I threw in a VEML7700 to measure ambient light, but haven’t made super good use of that data.
Olimex ESP32-POE-ISO development board is the brains of the operation, and probably the best POE ESP32 money can buy.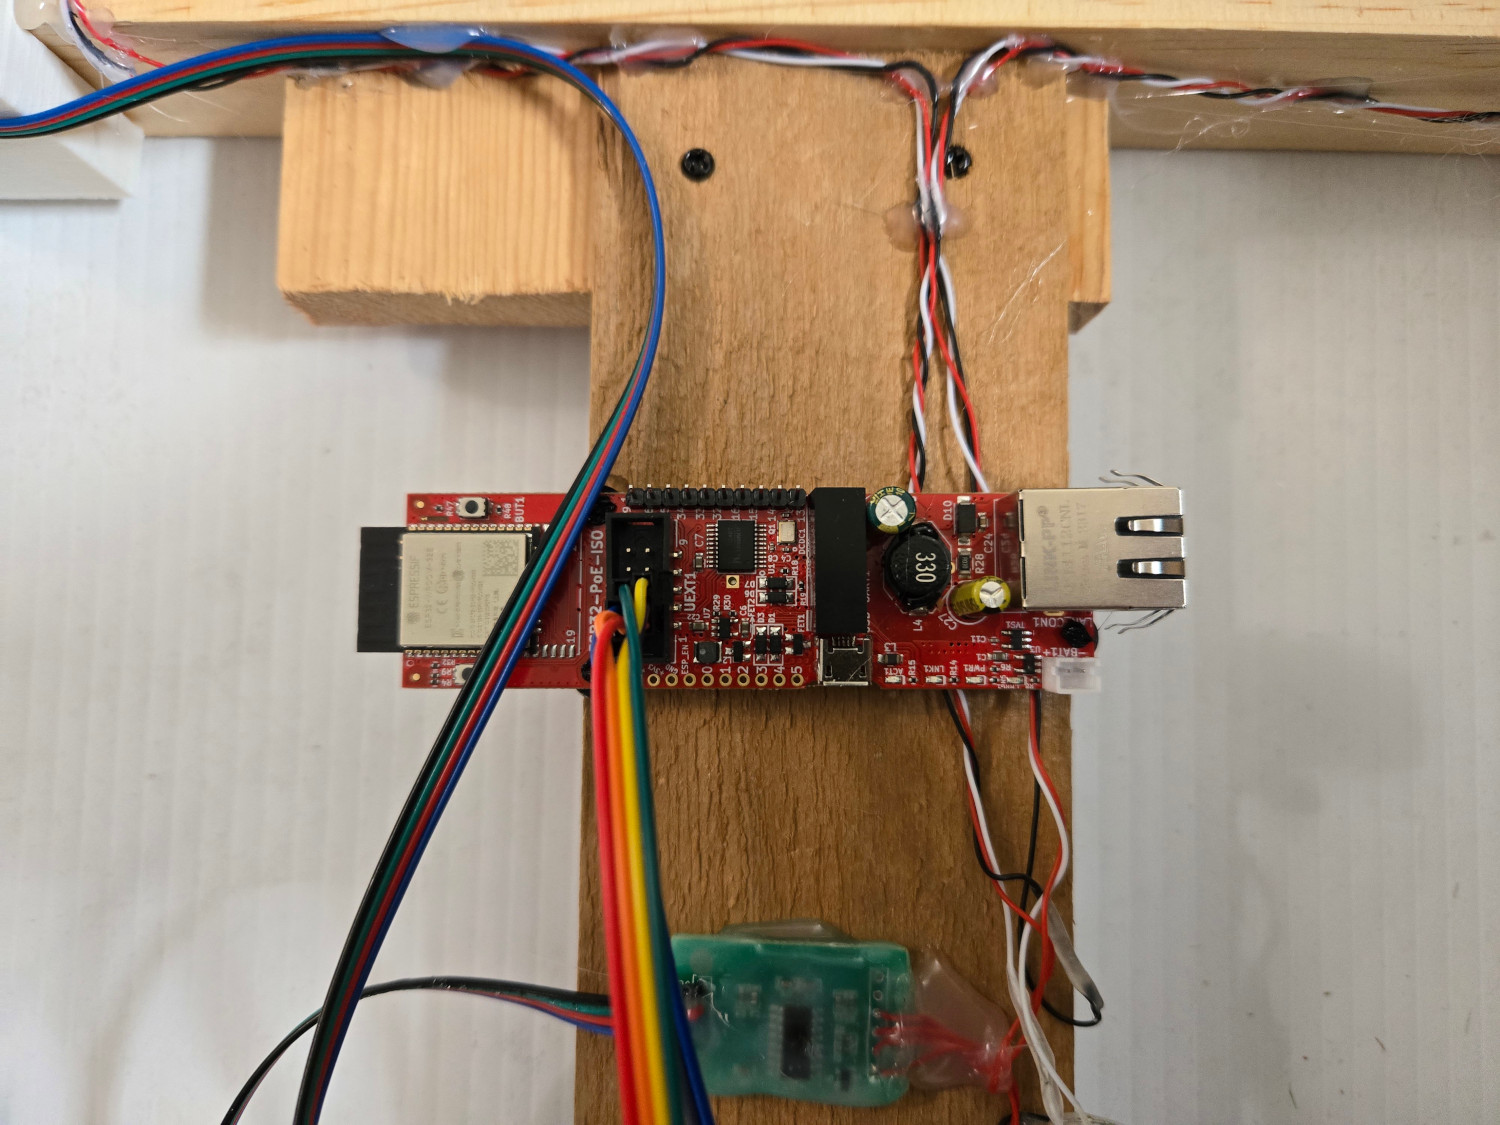
Daughter board assembly, and HX711 module.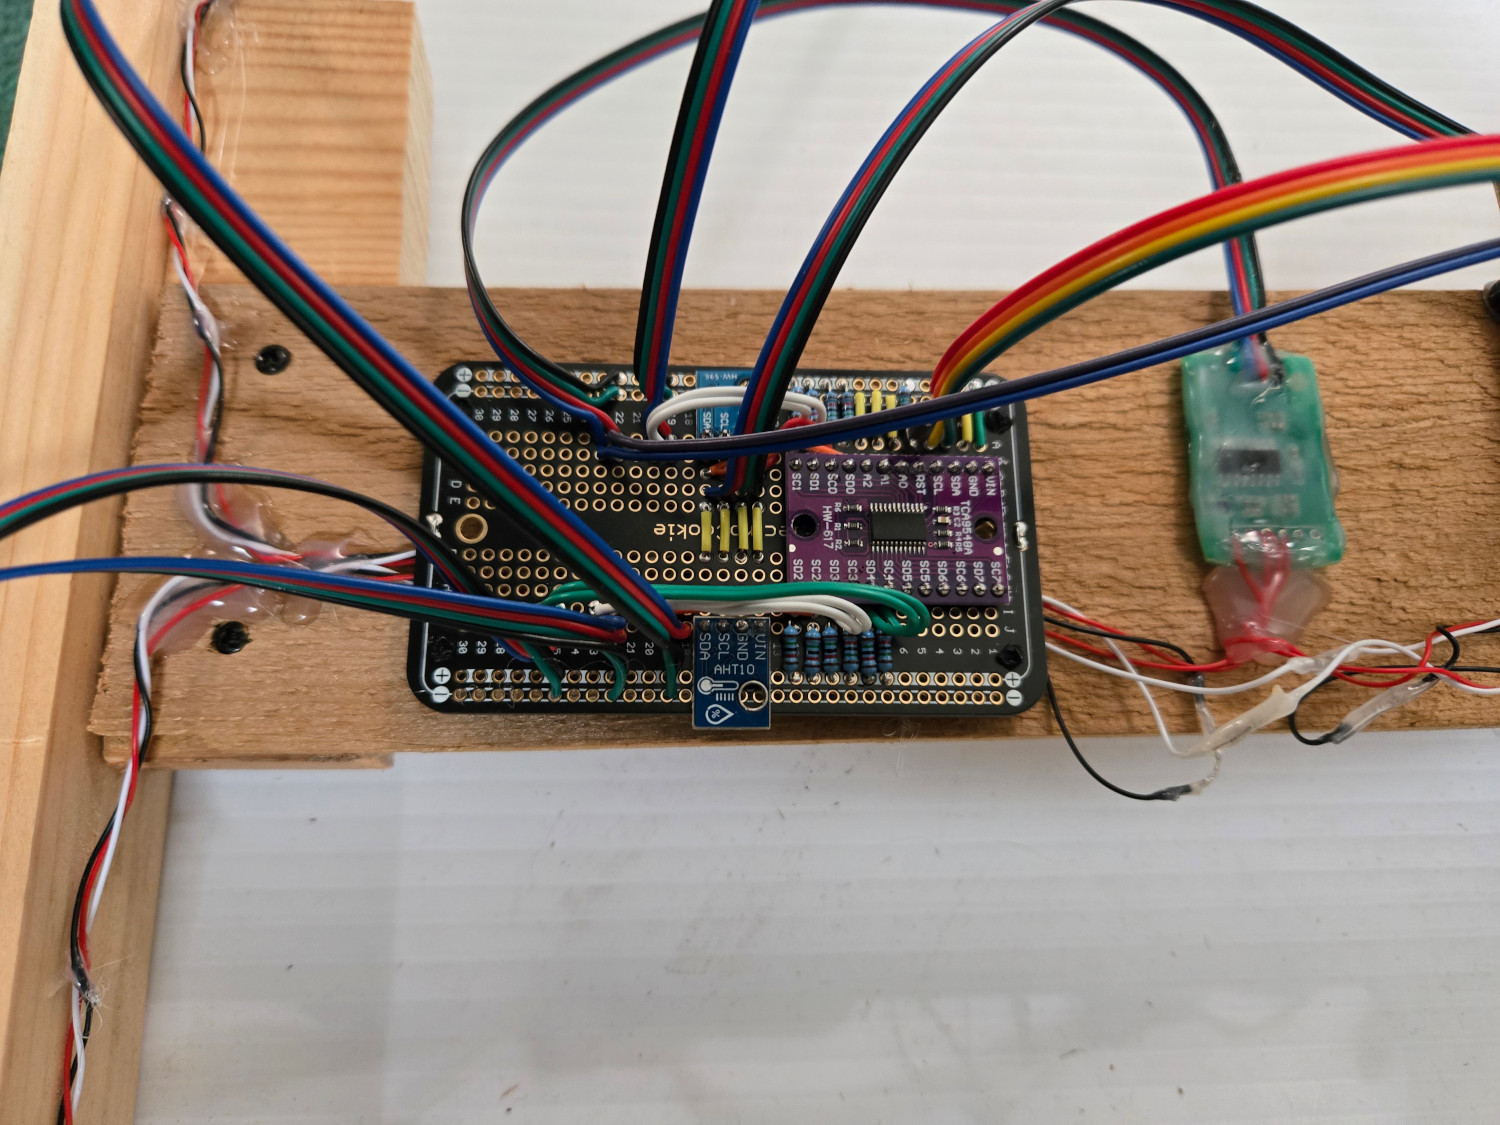
Sensor enclosures, attachments, and assembly
AHT10 3D printed enclosures. The two parts snap together to make a porous enclosure.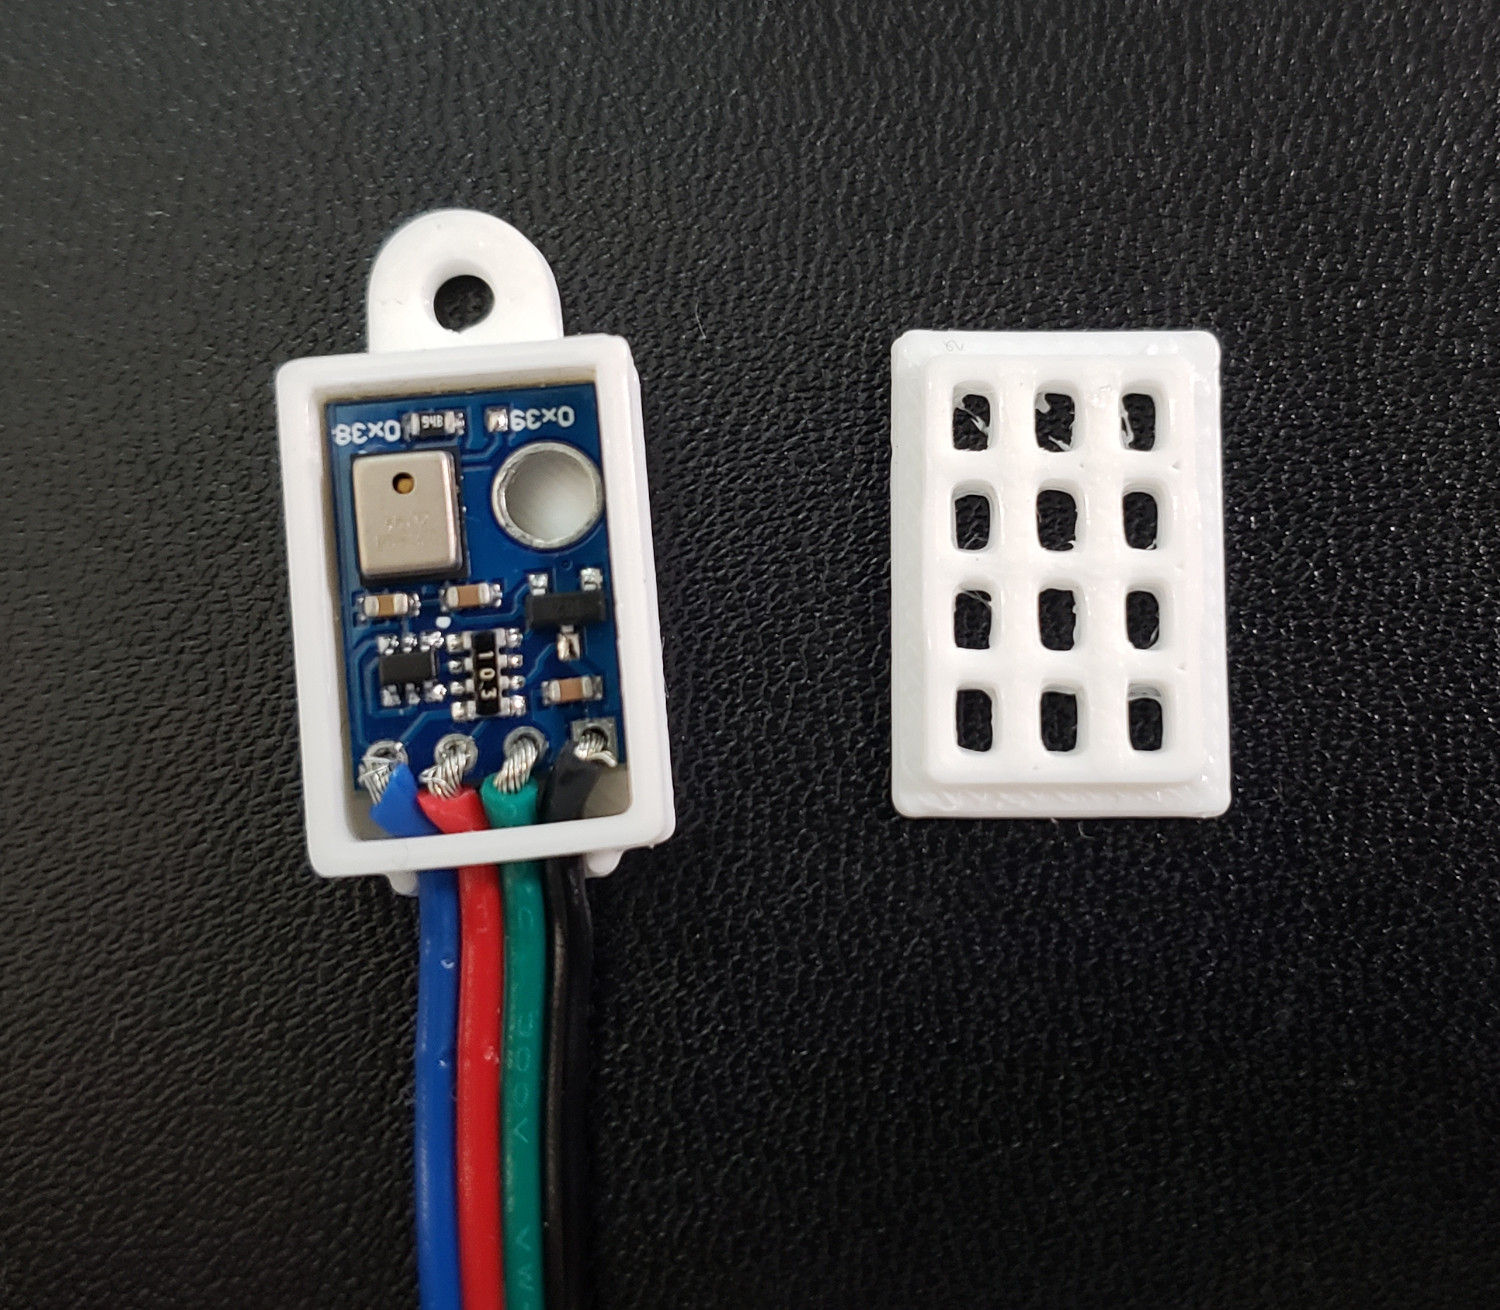
Supports to match the flat-top strain gauges to the vertical sides of the screened bottom board. Secured with hot glue, as the force is distributed. The rest of the hive would be built on top, so this needs to be able to take and measure a substantial amount of force.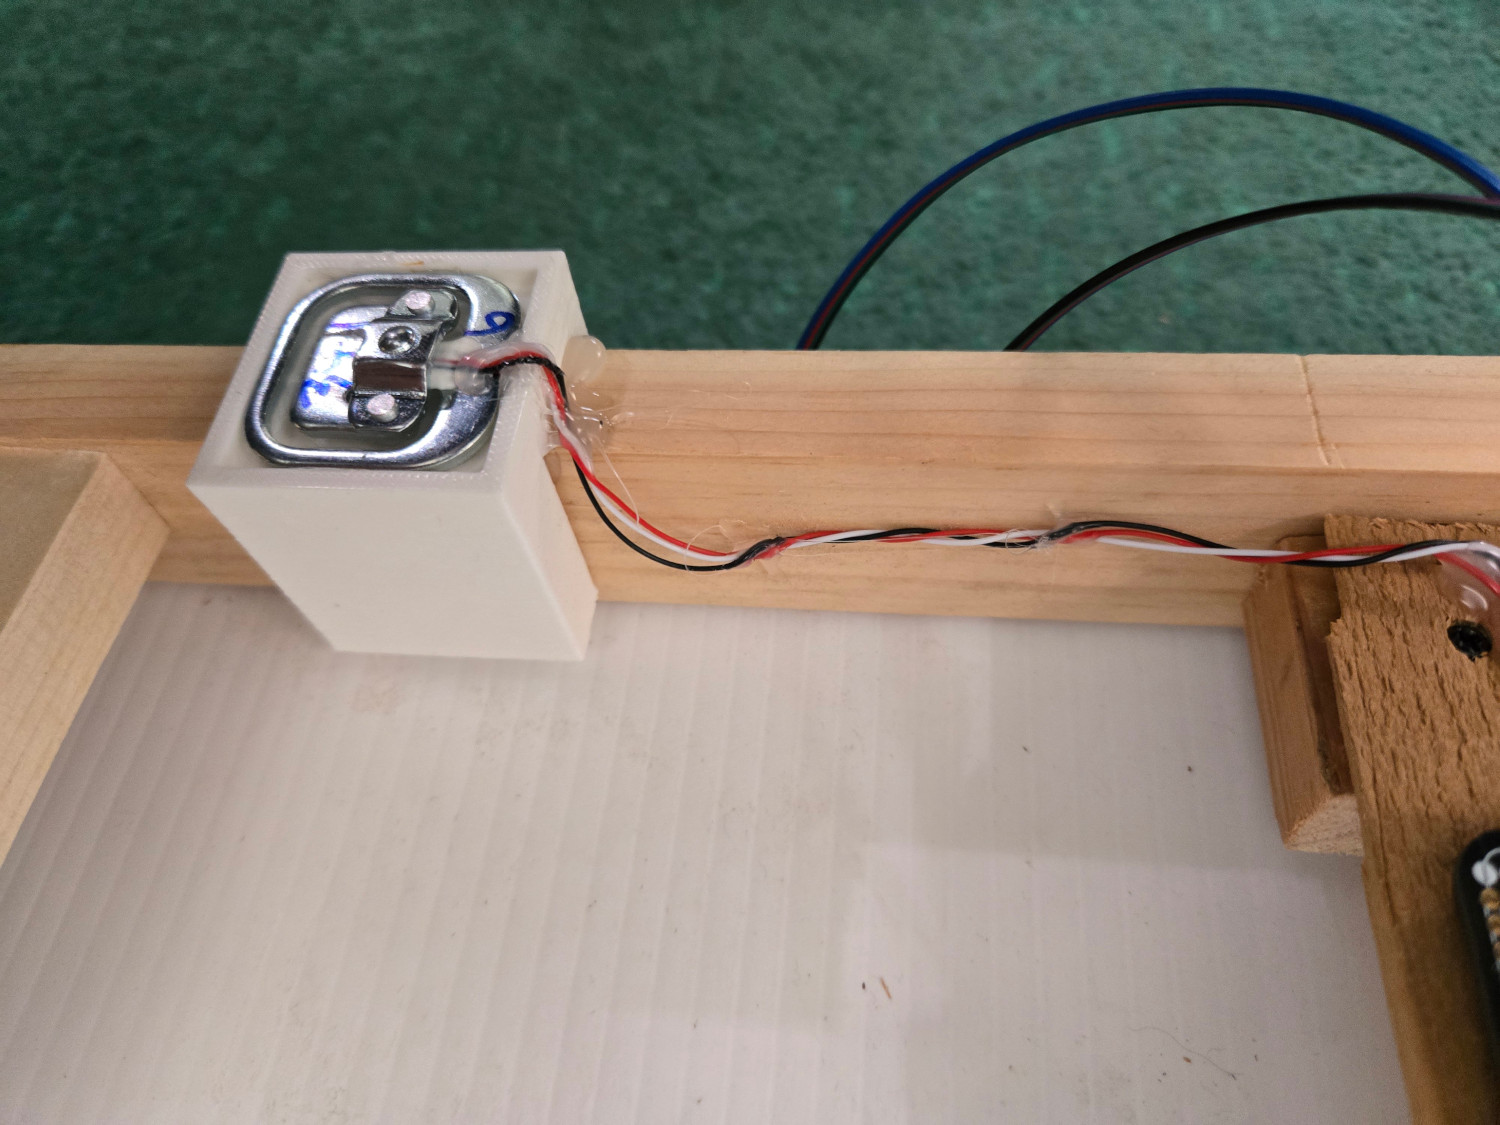
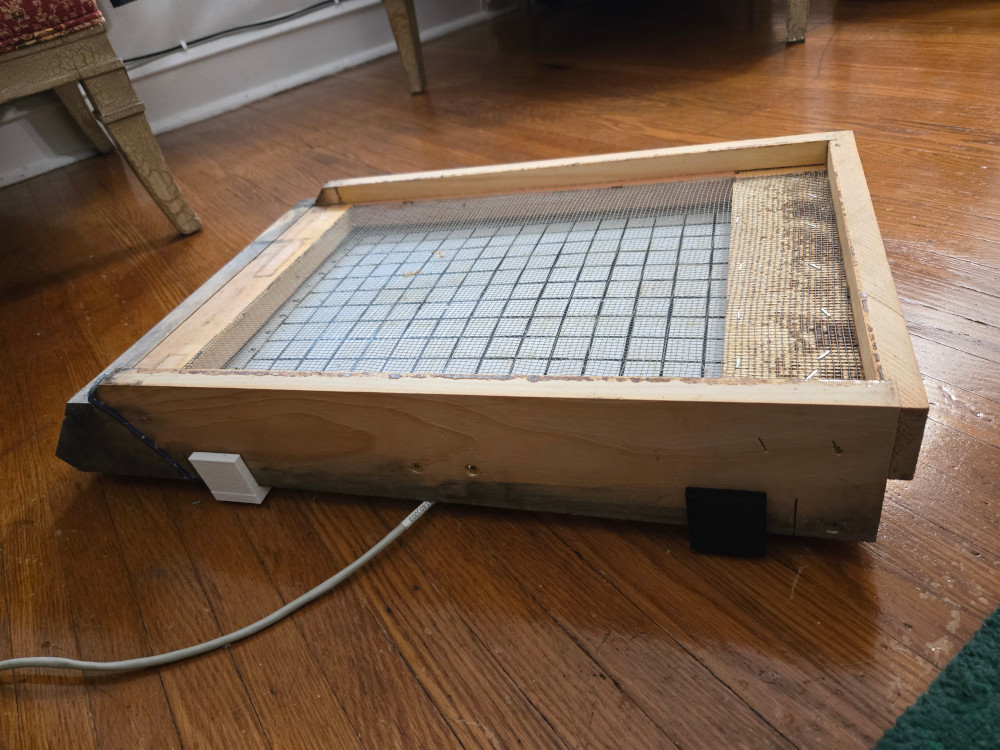
The fully assembled BeeLogger smart bottom board prototype.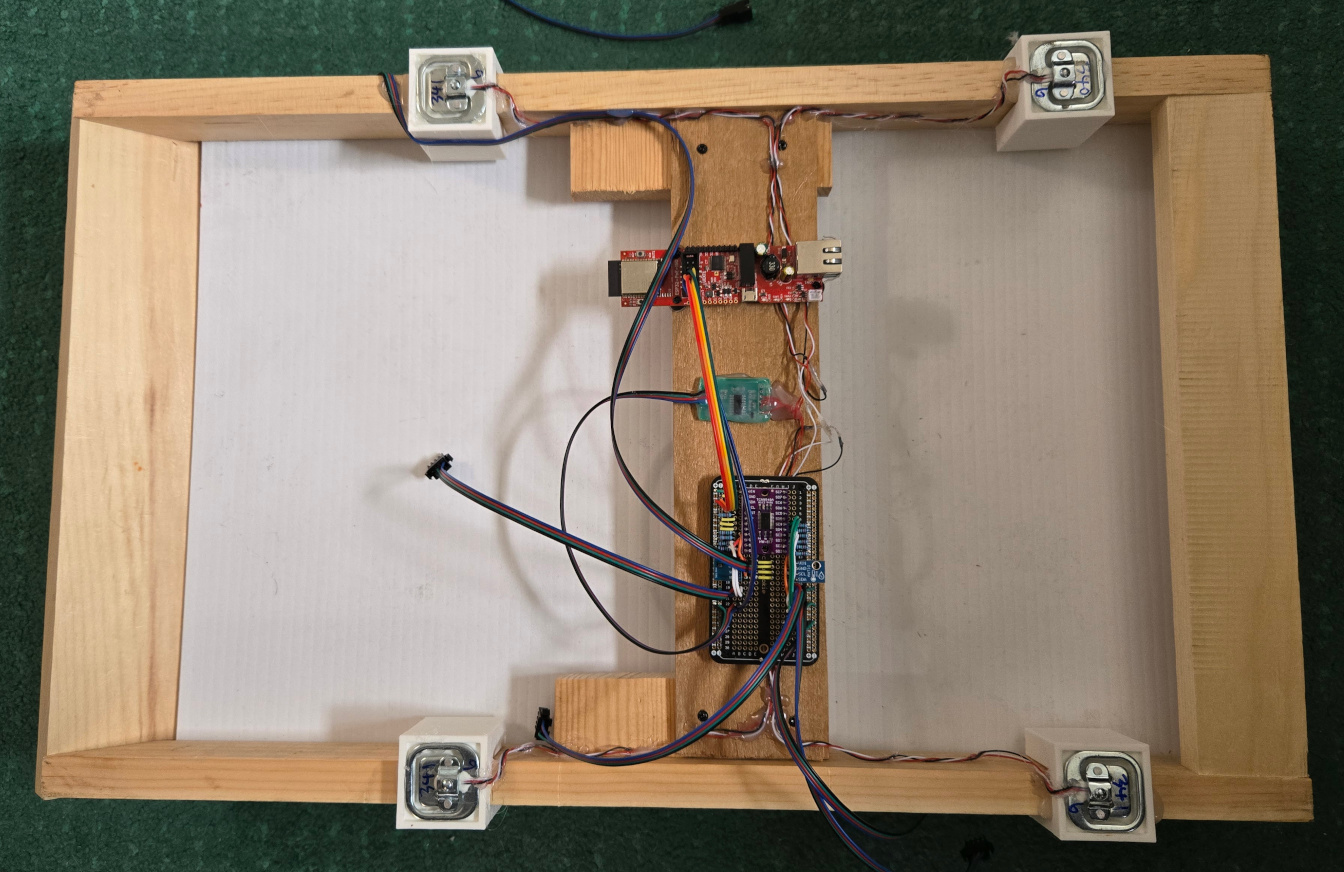
The Software
Like other ESP32 platforms, the Olimex boards fully support MicroPython, and I had no issues using Thonny to both install the MicroPython firmware onto the boards, nor with loading and developing the firmware. The full BeeLogger firmware will automatically acquire a DHCP IP from the network it receives PoE from, and starts up a webserver implementing several GET and POST endpoints for reading the sensors and otherwise controlling the hardware. The Git repository is setup according to the way I have hardware connected, but this would be easy to adjust with some knowledge of Python, making this a pretty general base to develop any other REST API for I2C sensors.
The server endpoints currently accept no arguments, but could accept a JSON body in an HTTP request if that is needed.
One of many endpoints provides all the necessary functionality. A GET request to /report will enumerate all sensors, for instance.
benland100@blandtoo ~ $ curl -o- http://beelogger1.home.arpa/report
{
    "humidity_4": null,
    "ambient_lux": 33973.86,
    "temperature_4": null,
    "status": "OK",
    "ext_temperature": 11.85889,
    "temperature_3": null,
    "temperature_0": 12.50401,
    "temperature_1": 34.8093,
    "temperature_2": 28.8414,
    "humidity_3": null,
    "humidity_2": 70.4463,
    "humidity_1": 61.10268,
    "humidity_0": 80.68142,
    "weight": 54.06561,
    "ext_pressure": 99.85258
}
The result of a valid endpoint is always a JSON payload containing some data relevant to the endpoint. Check out the source for the details.
Acquiring, saving, processing, and displaying the data
Since it was already running as a system service, I opted to integrate the data gathering into the BeeCam infrastructure. Ultimately this runs as a service and polls the easy to read sensors every ten seconds, and the trickier sensors like weight and pressure every minute. The service creates two tables in a SQLite database, appending the results of each poll to the respective table.
CREATE TABLE IF NOT EXISTS fast_sensors (
    timestamp, ambient_lux,
    temperature_0, humidity_0,
    temperature_1, humidity_1,
    temperature_2, humidity_2,
    temperature_3, humidity_3,
    temperature_4, humidity_4
)
CREATE INDEX IF NOT EXISTS timestamp_fast ON fast_sensors ( timestamp )
CREATE TABLE IF NOT EXISTS slow_sensors (
    timestamp, weight,
    ext_temperature, ext_pressure
)
CREATE INDEX IF NOT EXISTS timestamp_slow ON slow_sensors ( timestamp )
The last two temperature and humidity sensors are unused currently, but the first three correspond to the onboard (under the hive) sensor, one placed near the center of the brood area, and one at the very top of the stack.
While that acquisition runs asynchronously in the background another service processes the data into some interactive Plotly timeseries, which you can load inline and explore below:
Data processing pipelines with SQLite
Combining the results from the existing BeeCounter database and the new BeeLogger database efficiently into a long running timeseries with SQLite was a bit of a trick. Ultimately it’s a two part process, where the first part continuously reprocesses the last ~day (to give it some redundancy) of data into average values for 5-minute intervals, inserting the results into yet another SQLite database table.
CREATE TABLE IF NOT EXISTS summary (
    timestamp DATETIME NOT NULL PRIMARY KEY,
    bee_count, ambient_lux, weight,
    ext_temperature, ext_pressure,
    temperature_0, humidity_0,
    temperature_1, humidity_1,
    temperature_2, humidity_2,
    temperature_3, humidity_3,
    temperature_4, humidity_4
)
Each input dataset can be processed separately by attaching the dataset to the SQLite instance, and using insert conflict resolution to handle piecewise updating of columns.
INSERT INTO summary (timestamp, bee_count)
    SELECT
        datetime(floor(unixepoch(b.timestamp)/?)*?, 'unixepoch') as timestamp,
        avg(b.bee_count) as bee_count
    FROM count.bee_counter b
    WHERE b.timestamp >= ?
    GROUP BY timestamp
    ORDER BY timestamp
ON CONFLICT(timestamp) DO UPDATE SET
    bee_count = excluded.bee_count
The second part simply reads from this summary table to generate the Plotly html export of the metrics you can load above.
First Winter Results
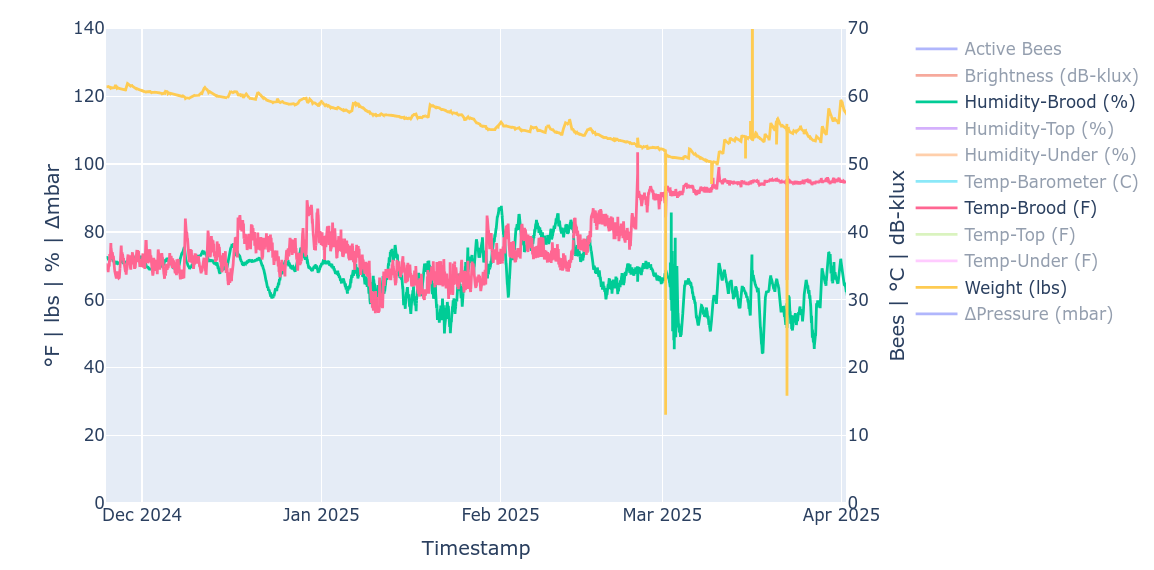
Just in case the live version above doesn’t load for some reason, the screenshot below shows the 2024-2025 Winter season for the colony that made it all the way to Spring.
Being able to see the fact that there was enough honey in the hive and a sufficient brood box temperature, even in the late winter months, made it a lot easier to know there was no need for concern.
A selection of critical sensors from the 2024-2025 Winter, showing the consumption of honey (and evaporation of the resulting water) in late Winter, and the foraging activity that resumed in the early Spring. The rise of brood temperature at the end of February corresponded to the resumption of egg-laying by the overwintered queen. Discontinuities in the weight correspond to hive inspections (disassembly of boxes) or weight of myself, animals, or precipitation (snow) on the box during measurement, until the Spring when the bees are capable of bringing back 10lbs of material in a working day.